
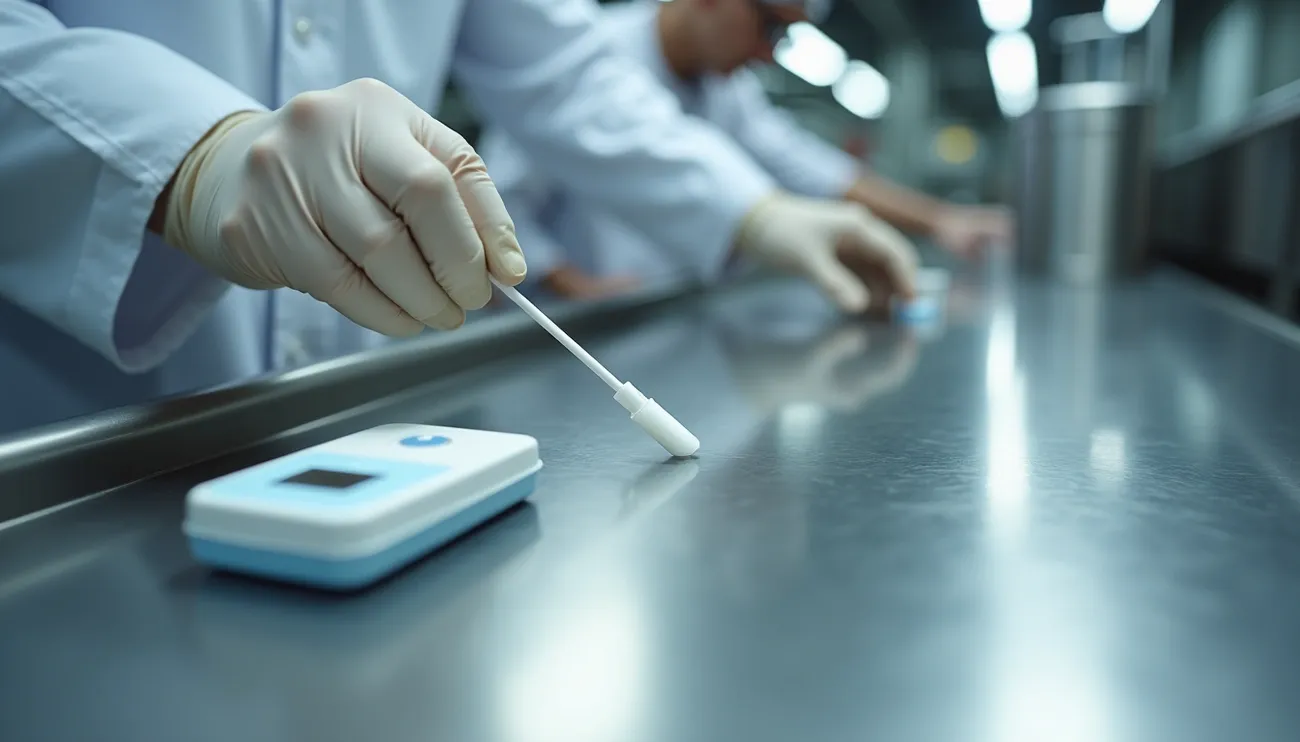
Allergen-related incidents account for much of food safety failures. About 60% of recalls or withdrawals within the food industry result from allergen notifications. Protein swab testing allergens has become a verification tool for food manufacturers seeking to confirm cleaning effectiveness and prevent cross-contact. Visual inspection and ATP testing provide original checks, but the allergen protein swab offers targeted sensitivity to organic residues that may harbour allergenic material. This piece gets into the allergen swabbing procedure and interpretation of protein test swab results. We also cover selection of allergen swab testing kits and integration of protein-based verification within layered allergen control programmes for audit and compliance purposes.
What is protein swab testing for allergen verification
Protein swab testing represents a non-specific screening method that detects total protein residues remaining on food contact surfaces after cleaning operations. The allergen protein swab responds to peptide bonds present across all protein types, unlike allergen-specific immunoassays that target particular allergenic proteins. This broad-spectrum approach makes protein swab testing allergens useful where multiple allergens may be present in production environments or where specific test kits for certain allergens remain unavailable.
Principle of total protein detection
Most protein test swabs rely on the Biuret reaction coupled with bicinchoninic acid (BCA) colorimetric detection as their chemical foundation. Under alkaline conditions, copper (II) ions form complexes with peptide bonds present in proteins and undergo reduction to copper (I) ions [1]. BCA reagent exhibits high sensitivity and specificity for copper (I) ions under these same alkaline conditions. It forms a purple-coloured complex upon binding [1]. The intensity of this chromogenic reaction associates semi-quantitatively with protein concentration. Greater protein loads produce faster colour transitions and deeper purple hues.
This detection chemistry targets peptide bonds rather than specific amino acid sequences, so the test remains blind to protein origin or molecular weight [1]. The reaction’s time-dependent nature requires standardised incubation periods. Colour changes observed within 30 minutes at 37°C provide valid positive results for protein residue. Changes that appear after this timeframe should be disregarded [1]. Operators must understand the specific interference patterns that the reaction’s reliance on copper ion reduction creates when they interpret results.
Types of protein test swabs available
Several chromogenic protein swab systems serve the food manufacturing sector. Each offers instrument-free operation and visual interpretation. AllerSnap devices detect protein residues as low as 3 μg when samples undergo 30-minute incubation at 37°C [1]. The test transitions from green to purple in the presence of protein. Printed colour charts on device labels eliminate interpretation guesswork [2]. Results demonstrate linearity across wide protein concentration ranges and support semi-quantitative assessment of residue loads [1].
Clean-Trace ALLTEC60 represents another option available. It can detect protein quantities as low as 3 μg on surfaces [3]. These swabs generate colour changes detectable by visual inspection and provide results within 10 minutes without laboratory infrastructure. PRO-Clean systems target protein residue verification as well. They operate on the principle that protein proves more difficult to remove from surfaces than glucose or other residues, which makes it a reliable contamination indicator [2].
Modern protein swabs use medical-grade construction that influences collection efficiency. Polyurethane foam tips bonded to handles deliver high particle collection capacity. They remain free from lint, adhesives and residues that could compromise sample integrity. Cotton swabs and sponges demonstrate inadequate performance for allergen verification work. Sponges fail to release protein residues into extraction solutions during analysis.
What protein swabs detect vs what they don’t
Protein swabs respond to any substance capable of reducing copper (II) ions to copper (I) ions. This creates both detection breadth and specificity limitations. The tests detect proteins from major allergen sources including egg, milk, gluten, soy, peanut and almond [3]. Most allergens fall within this protein category, which makes general protein detection a practical surrogate for allergen presence verification [2].
The non-discriminatory nature of these tests creates notable constraints. Protein swabs cannot distinguish between protein from peanut versus chicken, milk versus meat, or any other protein source [2]. A positive protein test result confirms protein presence but provides no identification of which protein triggered the reaction. It also cannot tell whether that protein derives from an allergenic source [3]. Detection limits of 50 μg protein [1] or 3 μg protein [1] prove less sensitive than allergen-specific lateral flow immunoassays for targeted allergen verification.
Reducing sugars such as glucose, uric acid, ascorbic acid from fruit juices, and tannins from tea products generate false positive responses. They reduce copper ions independently of protein presence [1]. This cross-reactivity with non-protein reducing agents requires operators to think over production context when they evaluate colour changes on post-cleaning swabs.
Protein swabs function on surfaces and detect only protein molecules. They offer no information about allergen presence in finished products [2]. These tools should be regarded as screening indicators within allergen cleaning validation programmes rather than confirmatory allergen tests. Situations that demand definitive allergen identification, quantification of specific allergen loads, or verification below protein swab detection thresholds require escalation to allergen-specific testing methodologies.
Protein swab testing methodology and procedure
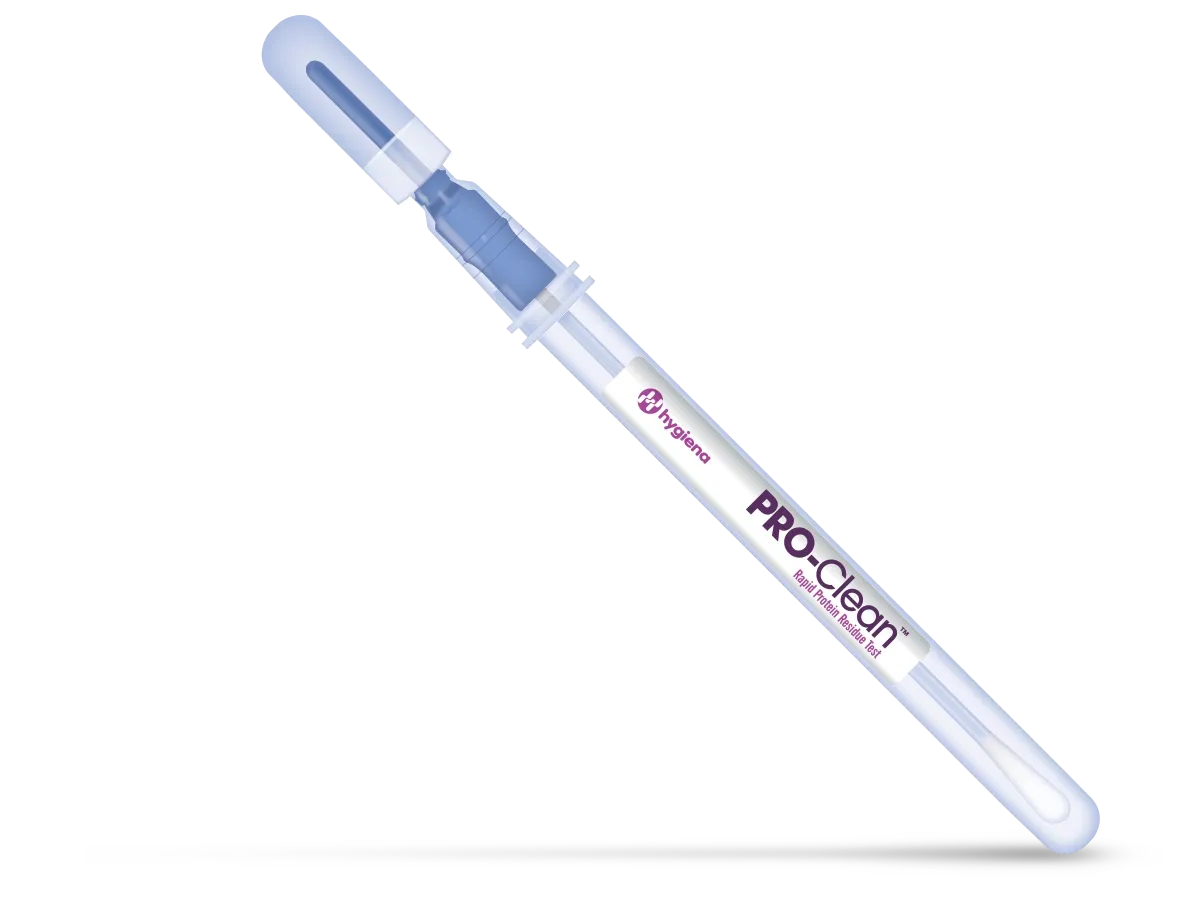
Image Source: Fmcg Industry Solutions
Protein swab testing methodology and procedure
Correct execution of the allergen swabbing procedure determines whether test results reflect actual surface conditions or introduce measurement artefacts that compromise verification integrity. Standardised protocols for protein swab testing allergens reduce operator-dependent variability and maintain reproducibility across shifts, equipment lines and validation cycles.
Step-by-step allergen swabbing procedure
The operational sequence for protein test swab deployment begins with equilibration to ambient temperature (21°C-25°C) [2]. Condensation visible inside swab tubes proves normal and does not indicate product failure [2]. Operators remove the swab by twisting and pulling the cap rather than straight extraction. This prevents contamination of the sampling tip [2].
Pre-moistening the swab with the supplied moisturiser solution maximises protein recovery for dry surfaces [4]. Wet surfaces require no additional moisture [1]. Operators activate the reagent after sample collection by breaking the internal snap-valve through forward and backward bending motions. They then squeeze the reagent bulb twice to expel liquid down the swab shaft [2]. Vigorous shaking for 5-10 seconds ensures complete mixing of collected material with detection chemistry [2][4].
Incubation requirements vary by product platform. Clean-Trace systems generate visual results within 10 minutes at room temperature when positioned upright [4]. Alternative formats require 15 minutes at 37°C or 30 minutes at the same temperature depending on detection threshold targets [2][4]. Operators compare final colour intensity against printed reference charts on swab labels and document results before production decisions [2].
Surface selection and preparation
Direct product contact surfaces where material encounters the production environment before final package closure receive priority in sampling hierarchies [1]. Tables, conveyor belts, buckets, fillers, hoppers and utensils constitute primary verification targets [1]. Equipment areas positioned above or adjacent to these contact zones warrant secondary attention [1]. This includes enclosed machinery components, compressed air lines and cleaning tools.
Flat, smooth stainless steel surfaces demonstrate optimal protein recovery characteristics in validation studies [4]. Restricting verification to flat areas that are available ignores crevices, joints, gaskets and threads where residues persist despite cleaning [4][5]. These difficult-to-clean niches demand specific attention within sampling plans [5].
Timing of sample collection relative to sanitation cycles affects result validity. Best practise dictates swabbing after detergent cleaning and rinsing but before terminal disinfection [2]. High concentrations of alkaline sanitisers generate false-negative outcomes under certain circumstances [2]. Adequate dwell time must elapse before deploying protein swabs when pre-disinfection testing proves impractical [2].
Sampling techniques: area, pressure and pattern
Standardised sampling area of 10 cm × 10 cm (4 inches × 4 inches) provides reproducible data comparable across test sessions [2][2][1][5]. Operators execute a crosshatch pattern and swab corner to corner in both diagonal directions [2][5]. Zigzag wiping that incorporates vertical, horizontal and diagonal passes in both orientations ensures complete coverage [2].
Continuous 360-degree rotation of the swab shaft during collection maximises tip contact with the sampled zone [2][5]. Sufficient pressure to create visible flex in the swab shaft transfers protein residues from surface to sampling medium [2][2][5]. Irregular surfaces require consistent technique adaptations during each test cycle. Operators swab large enough areas to collect representative samples [2].
Avoiding contamination and operator variability
Protein occurs on skin and hair naturally, creating contamination risk throughout sample handling [2]. Operators wash, dry and sanitise hands before gloving aseptically [1]. Direct contact with swab tips or test surfaces using bare hands invalidates results [2].
Chain of custody protocols require pre-labelling each swab unit before deployment [1]. Swabs lacking individual containers transfer to sterile plastic bags right after collection, with sample identifiers matching documentation forms [1]. Hand washing and glove replacement between sampling sites prevents cross-contamination [1]. Visibly soiled surfaces overload swab capacity and inhibit colour development reactions, producing inaccurate negative results [2]. So protein swabs function as verification tools for allergen cleaning validation rather than primary soil detection methods.
Training programmes that standardise area measurement, pressure application and stroke patterns across operators, shifts and production timeframes reduce special-cause variation in allergen protein swab programmes [5].
How to interpret protein swab test results
Result interpretation from protein test swab verification determines whether surfaces meet cleanliness standards or need re-cleaning before production resumes. The allergen protein swab generates colour-based outputs that need understanding of both chromogenic reaction kinetics and the qualitative nature of total protein detection.
Understanding positive vs negative results
Protein swab systems employ a traffic-light colour scheme where green shows pass results and purple signals failure [4]. Operators compare the liquid reagent colour against reference charts printed on swab tube labels. This eliminates subjective interpretation [4]. A grey intermediate zone represents caution status and suggests small residue quantities that warrant repeat testing or additional rinsing based on site protocols [4].
Timing of colour transition provides semi-quantitative information about protein load. Surfaces turning purple before 10 minutes contain substantial residue levels and need re-cleaning right away [4]. Colours that remain green throughout the full incubation period confirm acceptable cleanliness with no further action needed [4]. The speed at which purple develops associates with protein concentration. Faster changes suggest heavier contamination [4].
One key complaint from sites using protein swab testing allergens centres on the qualitative nature of results [4]. These tests generate non-specific, non-numerical outputs rather than precise protein quantities [4]. Operators receive pass/fail indications without definitive protein concentration values that quantitative laboratory methods provide.
Semi-quantitative vs qualitative outputs
Protein swabs deliver semi-quantitative assessment through colour intensity gradations rather than absolute measurements. The depth of purple colouration corresponds to protein levels. Darker hues reflect higher residue loads [4]. But this relationship provides relative rather than absolute quantification.
Operators must recognise that protein swabs cannot identify which protein triggered the colour change or whether that protein originates from allergenic sources [4]. The tests confirm protein presence without differentiating between peanut versus chicken, milk versus meat, or any other protein source [4]. This non-discriminatory detection pattern limits specificity to validate allergen cleaning where definitive allergen identification becomes necessary.
Detection thresholds and acceptance criteria
Sensitivity specifications vary by product platform and incubation duration. Protein swabs detect 80 μg after 1 minute, 50 μg after 5 minutes, and 20 μg after 10 minutes at temperatures between 20°C and 25°C [4]. Operators discontinue timing if purple develops before the 10-minute endpoint [4].
Detection capability proves limited compared to allergen-specific immunoassays. Protein swabs detect samples only up to 10²-fold dilution. This makes them slightly more effective than conventional ATP testing but much less sensitive than advanced adenosine detection systems [4]. More sophisticated methods detect protein at 10 parts per million levels calculated by ELISA and Bradford assays [4].
Sites must establish protein detection limits lined up with allergen risk thresholds rather than relying on generic pass/fail criteria. The limited response below approximately 2 μg/mL and departure from linearity below 5 μg/mL constrains application in scenarios that need high sensitivity verification [1].
Influence of surface type and residue characteristics
Swab composition and structure affect collection and release efficiency substantially. This creates statistically substantial differences in protein recovery between swab varieties [6]. The use of inappropriate swabs guides to false negative or misleading analysis results [6]. Surface characteristics further complicate interpretation as protein recovery efficiency varies across material types tested.
Thermal processing or exposure to chemical agents denatures proteins and compromises protein-specific test results [4]. Denaturation alters protein structure such that Biuret chemistry fails to generate expected colour transitions despite residue presence. False negative outcomes arise when highly denatured proteins remain on surfaces yet produce no visual indication during testing.
False positive results occur through interference from non-protein reducing agents present in production environments. These anomalies require operators to think about production context and residue history when evaluating colour changes during post-cleaning verification programmes.
Detection limits and sensitivity of protein swab testing
Commercial protein swab platforms specify detection capabilities ranging from 3 μg to 50 μg of total protein, yet these nominal specifications mask significant technical complexity regarding limit of detection (LOD) and limit of quantitation (LOQ) performance [7] [8]. The absolute detection threshold varies with the protein composition of samples tested and creates allergen-dependent sensitivity patterns that complicate verification programme design [5].
Sensitivity range of protein swabs
AllerSnap and Clean-Trace ALLTEC60 systems detect protein quantities as low as 3 μg when samples undergo proper incubation protocols [9] [7]. Detection limits demonstrate allergen-specific variation based on protein content within reference materials. Egg powder containing 30% protein shows detection at 10-20 μg. Whole milk powder with 25.9% protein content exhibits similar thresholds [5]. Peanut butter, containing 22.2% protein, requires 25-50 μg to detect reliably [5]. Gluten flour with approximately 83% protein content demonstrates detection at 40 μg, whereas soy flour at 46.5% protein and almond at 19.5% protein both fall within the 20-40 μg range [5]. Buckwheat flour, containing only 13% protein, requires 20-40 μg for positive results [5].
These variations reflect the fundamental principle that protein swabs respond to total protein mass rather than allergen-specific markers. But alternative protein detection methodologies report sensitivity down to 50 μg for standard applications [8]. The typical LOQ for protein assays approximates 2 μg/mL and leaves minimal area within calibration curves to estimate accurate values before acceptance criteria of 6.4 μg/cm² becomes exceeded [10].
Relationship to allergen risk thresholds
Robust analytical methods can detect milk, egg, peanut, certain tree nuts (almond, hazelnut, walnut, pecan, unprocessed cashew, pistachio), cod, and crustacea at ED05 reference dose levels in specific food matrices [1]. But protein swab testing allergens operates at much higher detection thresholds than these allergen-specific immunoassays. Qualitative ELISA methods typically detect allergen residues at limits approximating 5 parts per million [11], whereas protein swabs function in the microgram range on surface samples.
This sensitivity gap creates practical limitations for verification programmes targeting low-level allergen thresholds. Small surface areas subjected to swabbing release collected protein into limited extraction solution volumes before lateral flow analysis and may achieve sensitivity adequate for equipment verification despite limitations in finished product testing [11]. Because of dilution effects in high-volume production lines, detectable residues on equipment may not translate to measurable allergen quantities in final products [11].
Factors affecting detection capability
The limited response below approximately 2 μg/mL and departure from linearity below 5 μg/mL constrains protein assay application in scenarios that just need high sensitivity [10]. Standard curves demonstrate sigmoidal rather than linear characteristics at low concentrations. The lowest portions fail to approach zero using linear regression models whatever the R² values [10]. This mathematical limitation introduces potential error in protein concentration estimation, especially for values between LOD and LOQ where high data variability proves unavoidable [10].
Thermal processing or chemical agent exposure denatures proteins and compromises detection accuracy [12]. Protein swab tests detect samples only up to 10²-fold dilution and prove slightly superior to ATP testing yet nowhere near as good as advanced adenosine systems capable of detecting 10 parts per million levels [12]. Gelatin, being extracted animal protein, gets high sensitivity responses compared to other protein sources [12]. Matrix effects and surface characteristics further influence recovery efficiency and create site-specific performance patterns that just need independent validation before establishing protein detection limits that line up with allergen control objectives.
Protein swab testing vs ATP testing
ATP vs protein detection principles
ATP testing measures adenosine triphosphate, the molecule responsible for transferring energy within living cells [13]. The reaction produces light measurable by a luminometer in relative light units (RLU) when ATP contacts a reagent containing the enzyme luciferase [13]. Food residue and microorganisms at higher levels generate more ATP, so they produce greater light output [13]. The chemistry behind this bioluminescent reaction mirrors the mechanism that causes fireflies to glow [13].
ATP testing allergens operates on different detection chemistry than protein swab testing allergens. ATP systems cannot distinguish whether RLU results derive from bacteria, yeast, mould or food residue [13]. Surfaces never present only microbial ATP because bacteria require food to grow. This makes it impossible to determine contamination sources from numerical readings alone [13]. The amount of ATP in microbial cells varies, whereby a single colony-forming unit may comprise one or many cells [13].
Specificity differences for allergen verification
The non-discriminatory nature of ATP detection creates fundamental limitations for allergen control programmes. ATP readings cannot distinguish milk from lettuce or peanut from rice [14]. Equipment can pass ATP thresholds yet still harbour clinically important allergen quantities [14]. Processing effects compound this issue. ATP degrades through heat or oxidising agents, reducing signal output even when allergenic proteins persist on surfaces [14].
Low-ATP foods such as refined oils, sugars and starches carry allergen protein with minimal ATP signal [14]. ATP appears ‘clean’ whilst allergen risk remains present in both scenarios [14]. For this reason, ATP testing allergen limitations prove substantial when facilities attempt using these systems as primary allergen verification tools [15].
When protein swabs provide more meaningful data
Protein-based verification delivers targeted specificity that ATP systems cannot match. Most allergens fall within the protein category. This makes total protein detection a practical surrogate for allergen presence [13][16]. Protein swabs detect allergens including nuts, shellfish, soy and milk [16], providing more meaningful data in facilities processing high-protein allergenic commodities [17].
Facilities handling nuts alongside non-allergen commodities should deploy allergen-specific or protein-based tests rather than ATP systems to prevent cross-contact on shared equipment [17]. Protein swabs prove valuable where no specific test kit exists for screening particular allergens [13]. These instrument-free systems deliver results within 5 to 30 minutes depending on incubation requirements [16]. They prove affordable for collecting multiple verification data points [16].
Both methodologies serve complementary roles rather than replacement functions. ATP testing provides rapid feedback for routine pre-operational sanitation checks, whilst protein swabs deliver specificity for food allergen control UK programmes [18]. Facilities incorporate both methods to monitor different risk types in production zones and equipment lines [18].
Protein swab testing vs visual inspection methods

Image Source: Hygiena
Visual examination remains the most common verification method in food manufacturing facilities, yet this widespread reliance masks fundamental sensitivity limitations that compromise allergen control programmes. Operators assess cleanliness through naked-eye inspection under the lighting conditions they have and declare surfaces acceptable when no visible residue appears present. This approach is subjective and gets influenced by lighting intensity, inspection angle, operator experience and fatigue levels [4]. Visual inspection also becomes irrelevant for instruments containing cracks, joints, lumens and enclosed channels where residues accumulate beyond direct line of sight [4].
Role of protein-reactive sprays and visual checks
Equipment surfaces must appear clean after sanitation procedures, meaning no visible residues when viewed under appropriate lighting [19]. Visual residue limits give non-selective cleaning assessment, but visual detection thresholds vary across soil types and surface materials. Research demonstrates this limitation: vacuum cleaning removed visible dry soils of peanut flour, milk powder, whole egg powder and soy flour from most surfaces tested. Despite achieving clean status, total protein swabs produced positive results for all soils on all surfaces [20]. This discrepancy between visual cleanliness and actual protein presence reveals the inadequacy of relying on visual verification alone for allergen cleaning validation.
Protein-reactive sprays offer an intermediate verification approach between naked-eye inspection and swab-based testing. These colorimetric reagents generate visible colour changes when applied to surfaces containing protein residues and extend visual inspection capability beyond baseline perception thresholds. In spite of that, penetrability limitations affect these spray applications, as reagents may fail to reach protein within thick residue layers or porous material depths [4].
Speed vs sensitivity trade-offs
Visual inspection delivers immediate feedback without sample collection, incubation or reagent activation steps. Operators complete visual checks within seconds and enable rapid production decisions. Protein test swab methods require 5 to 30 minutes depending on incubation protocols and detection thresholds targeted. This time differential creates operational pressure to favour visual methods during changeovers.
Speed advantages dissolve when visual inspection fails to detect allergenic residues that trigger consumer reactions. The 17% of facilities deploying visual allergen detection supplemented by protein-specific tests acknowledge this sensitivity gap [12]. Protein swabs detect residues in locations that visual examination cannot reach, including instrument crevices, cannulated elements and endoscope channels [4]. The swab technique proves suitable for any instrument size and complexity and reaches verification zones where visual methods give no data [4].
Combining methods for improved confidence
Ideal cleanliness verification incorporates three methodologies operating in concert. Visual inspection serves as first-line screening and identifies gross contamination requiring immediate re-cleaning. Protein swabs follow visual clearance and target contact zones at high risk and niches that are difficult to clean where residues persist despite acceptable visual appearance. Allergen-specific immunoassays provide confirmatory testing when protein swabs indicate residue presence or when regulatory requirements demand definitive allergen quantification. This layered approach balances operational speed with verification sensitivity and creates food allergen control UK programmes that withstand audit scrutiny whilst maintaining production efficiency.
When to use protein swab testing in verification programmes
Food manufacturers deploy protein swab testing allergens in specific verification contexts where rapid, instrument-free protein detection addresses defined control objectives. Survey data reveals 17% of sites rely on protein-specific tests for allergen management [12]. This reflects growing recognition of these tools’ role in structured verification programmes.
Post-cleaning allergen verification
Non-specific protein swabs serve routine post-cleaning verification after sanitation procedures [21]. Quality assurance technicians and line operators swab critical zones that include food contact surfaces, conveyor belts and nozzles. They do this to verify that protein residues have been removed before subsequent production runs [21]. The 10-minute result timeframe allows immediate corrective action [22] and enables re-cleaning before production schedules face disruption.
Changeover validation support
Changeover validation just needs multiple equipment swabbings post-sanitation [23]. Cleaning procedures achieve effective validation status for specific lines and formulations once no allergen residues prove detectable during two successive cycles [23]. ATP measurements can supplement validation studies. Protein swabs serve less frequent verification roles [24].
High-risk production environments
Production environments handling multiple allergens benefit from protein swab integration into HACCP programmes to monitor cleaning effectiveness [22]. High-risk zones just need targeted verification where cross-contact poses lifted consumer risk [25]. Facilities can establish risk-based sampling plans that line up with zone classification systems.
Integration within layered verification strategies
Layered approaches position protein swabs among allergen-specific methods in complete verification frameworks [24][26]. Sites incorporate validation proving cleaning process capability and verification confirming that validated procedures were followed. They also monitor in-process parameters [26]. This multi-method strategy reduces reliance on single verification tools and addresses distinct verification questions across production cycles [27].
When to escalate to allergen-specific testing
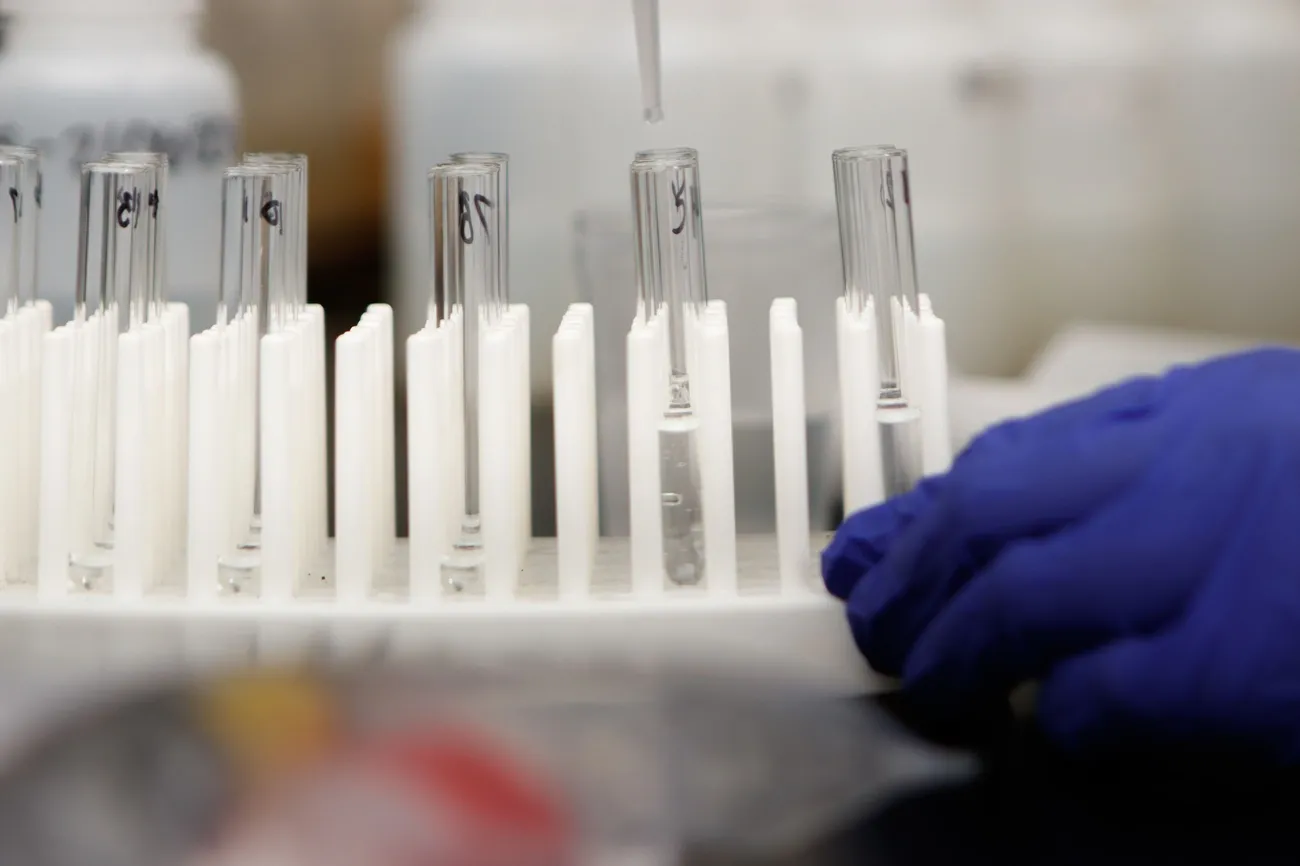
Image Source: Neogen
When to escalate to allergen-specific testing
Protein swab results suggesting residue presence trigger escalation decisions based on allergen risk profiles, detection sensitivity requirements and verification programme objectives. Facilities must determine the point at which non-specific screening proves insufficient to protect allergic consumers and support due diligence defences.
Moving from protein swabs to LFD or ELISA tests
Protein-targeted immunoassays detect allergenic proteins at much lower thresholds than total protein swabs. Typical performance ranges from 0.5 to 10 parts per million in food matrices and 0.05 to 50 µg per swab on surfaces [14]. Lateral flow devices provide rapid on-site screening at the time protein swabs suggest residue presence but allergen identity remains unknown. ELISA methods deliver quantitative data for finished product validation and regulatory submissions. They operate with high specificity for target allergens [28]. So sites escalate from protein swabs to immunoassays at the time verification demands allergen identification, quantification below protein detection thresholds, or matrix-specific validation data that supports risk-based allergen control decisions.
High-risk allergens and low threshold sensitivities
Reference doses from clinical challenge studies define allergen thresholds that trigger precautionary labelling requirements. ED05 represents the eliciting dose causing objective reactions in 5% of allergic populations, whilst ED01 affects 1% [1]. VITAL 3.0 threshold recommendations provide action levels for peanut, milk, egg, tree nuts, soy, wheat, mustard, lupin, sesame, crustacea, celery and fish [29]. Allergen-specific testing becomes mandatory at the time protein swab sensitivity (3-50 µg) exceeds acceptable risk thresholds for highly sensitising allergens. It’s also required for production involving low-threshold commodities that just need parts-per-million verification capability.
Regulatory and customer audit requirements
Independent audit programmes including AllergyWise assess allergen procedures through rigorous evaluation. Partner laboratories conduct allergen testing on product samples to verify ‘allergen-free’ claims [30]. Testing costs approximate £55 to £141 per sample and create financial considerations for verification programme design [1]. Laboratories performing allergen analysis require ISO 17025 accreditation and demonstrated proficiency through FAPAS testing schemes [31]. Customer specifications mandate allergen-specific testing data rather than accepting protein swab results alone. This applies particularly to food allergen control UK compliance and export market access.
Conclusion
Protein swab testing allergens provides rapid, instrument-free verification of cleaning’s effectiveness within structured allergen control programmes. These non-specific screening tools excel at detecting total protein residues in allergen types of all kinds. They fill verification gaps where specific test kits remain unavailable. Sites must recognise that protein swabs cannot identify which allergen triggered positive results. They also cannot measure specific allergenic proteins below detection thresholds. Layered verification strategies combining protein swabs and allergen-specific immunoassays deliver optimal protection for allergic consumers and support audit compliance. Facilities seeking to implement evidence-based protocols should establish risk-based sampling plans that match production complexity and allergen profiles.
Key Takeaways
Protein swab testing offers rapid, instrument-free allergen verification but requires understanding of its capabilities and limitations for effective implementation in food manufacturing environments.
• Protein swabs detect total protein residues (3-50 μg) within 10-30 minutes but cannot identify specific allergens or differentiate between protein sources • Proper sampling technique requires standardised 10cm × 10cm areas, crosshatch patterns, and 360-degree swab rotation to ensure reliable results • Visual inspection alone proves inadequate—surfaces appearing clean can still harbour detectable protein residues that trigger positive swab results • Escalate to allergen-specific ELISA or lateral flow tests when protein swabs show positive results or when verification requires sub-microgram sensitivity • Implement layered verification combining visual checks, protein swabs, and allergen-specific testing for comprehensive allergen control programmes
Protein swabs serve as valuable screening tools within broader allergen management strategies, providing rapid feedback for post-cleaning verification whilst supporting regulatory compliance and consumer protection objectives.
FAQs
Q1. What is the main difference between protein swab testing and allergen-specific testing? Protein swabs detect total protein residues from any source but cannot identify which specific allergen is present. They respond to all proteins equally, whether from peanuts, milk, meat or other sources. Allergen-specific tests like ELISA or lateral flow devices target particular allergenic proteins and can identify and quantify specific allergens at much lower detection thresholds, typically between 0.5 to 10 parts per million.
Q2. How long does it take to get results from a protein swab test? Protein swab tests provide results within 10 to 30 minutes depending on the specific product system and incubation protocol used. Some systems like Clean-Trace generate visual results within 10 minutes at room temperature, whilst others may require 15 to 30 minutes at 37°C. This rapid turnaround allows immediate corrective action if re-cleaning is needed before production resumes.
Q3. Can protein swabs detect allergens on all types of surfaces? Protein swabs work on various food contact surfaces including stainless steel, conveyor belts, and equipment components. However, detection efficiency varies by surface type, with flat, smooth stainless steel surfaces showing optimal protein recovery. The swabs can reach difficult areas like crevices and joints where visual inspection fails, though highly porous surfaces or heavily denatured proteins may affect accuracy.
Q4. Why might a surface look clean but still test positive for protein? Visual inspection has significant limitations in detecting protein residues. Research shows that surfaces appearing visually clean after vacuum cleaning can still produce positive protein swab results. Protein residues may be invisible to the naked eye, particularly in small quantities, within surface irregularities, or when lighting conditions are suboptimal. This is why protein swab testing provides more reliable verification than visual checks alone.
Q5. When should facilities use protein swabs versus ATP testing for allergen control? Protein swabs are more suitable for allergen verification because most allergens are proteins, making protein detection a practical surrogate for allergen presence. ATP testing cannot distinguish between different contamination sources and may show ‘clean’ results even when allergenic proteins remain present, particularly with low-ATP foods like refined oils or sugars. Use protein swabs for post-cleaning allergen verification and ATP testing for routine sanitation monitoring of general cleanliness.
References
[1] – https://www.food.gov.uk/board-papers/precautionary-allergen-labelling-and-allergen-thresholds
[2] – https://www.neogen.com/496c85/globalassets/pim/assets/original/10001/lab-services-allergen-swab-collection.pdf?srsltid=AfmBOoreY5VgGQoJF_RgJkwzHutiOvAZY5i8mfGXnJzbivAOINHy8v5k
[3] – https://www.neogen.com/fr/usac/neocenter/blog/allergen-risk-assessment-when-to-use-test-kits/?srsltid=AfmBOorHNN-bRfMZOHqTVrwY2kUnJyFGXW6W3mGhO5m2AvtbjThEMqyR
[4] – https://cleanroomtechnology.com/medical-devices-hygiene-monitoring-through-protein-detection–159360
[5] – https://nelsonjameson.com/product/download/attachment/id/36455/file/cHViL21lZGlhL3Byb2R1Y3RfYXR0YWNobWVudHMvcHJvZHVjdF9kYXRhX3NoZWV0LzEwNzk3KDEpLnBkZg%3D%3D/link/13468/datatype/product_data_sheet/?srsltid=AfmBOopKTLw8WBueyO6TLobYJz0q1CrBP2gZ7DTiYrPRDeX7W3IjhE9k
[6] – https://pubmed.ncbi.nlm.nih.gov/32166638/
[7] – https://www.neogen.com/en/categories/allergens/clean-trace-surface-allergen-protein-test-swab/?srsltid=AfmBOorrFYkkFnkprE7eAyAizPancIEGIOpAKb5uRn9cCw3b0Sf68qKh
[8] – https://pubmed.ncbi.nlm.nih.gov/32221524/
[9] – https://www.hygiena.com/documents/63471/allersnap-and-detection-limits.pdf
[10] – https://pmc.ncbi.nlm.nih.gov/articles/PMC10764063/
[11] – https://www.food-safety.com/articles/4434-best-practises-with-allergen-swabbing
[12] – https://www.klipspringer.com/blogs/protein-swabs-vs-a3-testing-everything-you-need-to-know/
[13] – https://www.neogen.com/en/usac/neocenter/blog/atp-protein-and-allergen-testing-in-production-facilities-which-should-you-use/?srsltid=AfmBOoocZTKUGIWu22f56QPZZ0r3ltoqb93o5OYBZ79PWoQo6I4qHJ06
[14] – https://www.romerlabs.com/en/library/knowledge/detail/why-atp-isnt-a-substitute-for-allergen-verification
[15] – https://www.neogen.com/en/usac/neocenter/blog/why-atp-testing-is-not-sufficient-for-allergen-control-programmes/?srsltid=AfmBOop0CGAlXgJQkFA7y0DBwajD3bCivtp-KJ_Y75rXsbZqMANn5Vb0
[16] – https://emportllc.com/surface-testing-for-food-safety-what-is-the-difference-between-allergen-testing-and-atp-testing/
[17] – https://fieldreport.caes.uga.edu/publications/B1524-3/using-atp-protein-and-allergen-swabs/
[18] – https://www.neogen.com/en/usac/neocenter/blog/atp-and-protein-testing-for-hygiene-monitoring/?srsltid=AfmBOopyObP3YoWYycZ8deQNyRGwaVl2sfyuADy8QcojDLm5LT8TAYfM
[19] – https://www.biopharminternational.com/view/cleaning-validation-biopharmaceutical-manufacturing-genentech-inc-part-2
[20] – https://www.food.gov.uk/research/review-of-the-literature-and-guidance-on-food-allergen-cleaning-results
[21] – https://www.neogen.com/en/usac/neocenter/blog/allergen-risk-assessment-when-to-use-test-kits/?srsltid=AfmBOopzLGDVRhHu5yRjRG-fZ0YM0xHIlDZNrxg71fVJkJKUYMDvC269
[22] – https://trafalgarscientific.co.uk/swab-surface-protein-allergen-pk-60/?srsltid=AfmBOoptJDhqfm-x_M7QzD5Ygl1h4R7ac9OGQ4S6RWtYrY8aLRWPJ8U2
[23] – https://blog.puritanmedproducts.com/protein-test-swabs-how-to-verify-allergen-control
[24] – https://www.romerlabs.com/en/library/knowledge/detail/10-steps-to-validating-and-verifying-allergen-cleaning-procedures
[25] – https://www.testinglab.net/swab-sampling-in-high-risk-zones-according-to-iso-22000-guidelines
[26] – https://normex.ca/news/allergen-swabbing-why-validation-is-essential
[27] – https://www.linkedin.com/posts/foodsafetysolutions_allergencontrol-labelverification-preventivecontrols-activity-7448026695938236416-4iK6
[28] – https://www.neogen.com/en/usac/neocenter/blog/allergen-testing-methods-explained/?srsltid=AfmBOoo57wHwz3-DFXz4hdXwNcX91_GPxMuTH5H3F8NQBaAl5rCdtZOD
[29] – https://www.anaphylaxis.org.uk/fact-sheet/allergen-thresholds/
[30] – https://www.anaphylaxis.org.uk/business/allergywise-audit-programme/
[31] – https://www.food.gov.uk/research/review-of-allergen-analytical-testing-methodologies-stakeholder-engagement