

ATP testing remains the most popular methodology for food production sites, but ATP testing allergen limitations present critical gaps in allergen control programmes. 60% of recalls or withdrawals within the food industry result from allergen notifications. ATP test systems cannot detect and measure specific allergens of concern. The A3 test showed lower detection limits than ATP testing, and diagnostic tests for allergens have greater sensitivity for detecting allergen proteins at trace levels. This piece gets into why current atp testing standards fall short for allergen verification, explores the scientific constraints of atp testing thresholds, and shows why protein detection methods provide better risk control.
What ATP Testing Actually Measures
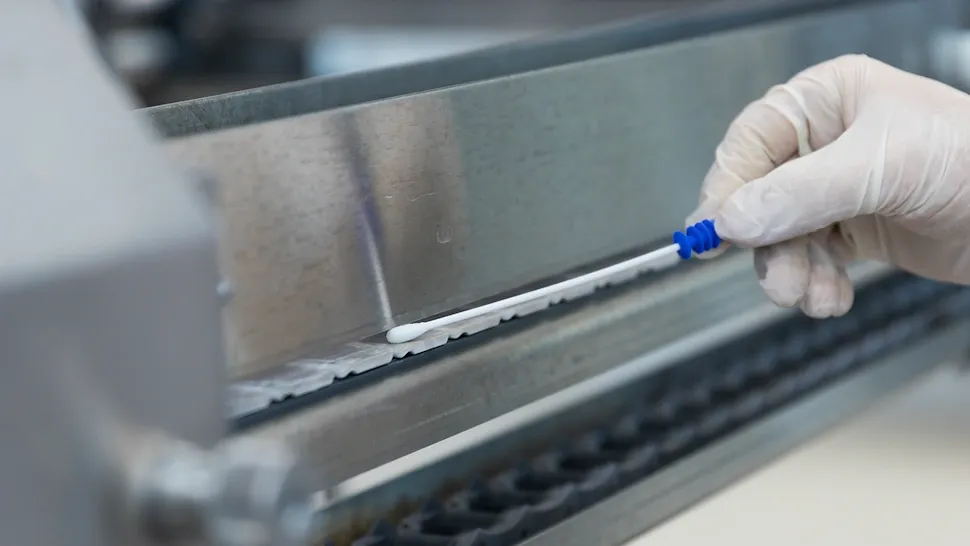
Image Source: Neogen
Adenosine Triphosphate as a Hygiene Indicator
Adenosine triphosphate functions as the main energy-carrying molecule in all living cells, including bacteria, fungi, plants, and animal tissue [1]. Cells that die stop producing ATP and existing ATP degrades faster [1]. This characteristic makes ATP a reliable marker for viable cellular material and organic residues.
ATP exists in multiple sources within food production environments. Organic matter such as food debris, blood, saliva, bodily fluids, and microbial contamination all contain ATP [2][2]. The molecule appears in shed skin cells, biofilms that bacteria produce, and surfaces that operators contact [3][2]. ATP presence signals incomplete cleaning rather than identifying specific contaminants.
Higher ATP concentrations indicate greater quantities of living cells or organic residues [1]. Food processing facilities use this relationship to assess whether surfaces harbour sufficient organic material to support microbial growth. The detection of total bioburden, rather than specific pathogen identification, positions ATP as a general hygiene indicator [3]. This broad detection capability serves hygiene monitoring programmes but creates most important gaps in allergen cleaning validation protocols where specificity matters.
The Bioluminescence Detection Mechanism
ATP measurement relies on the firefly luciferase enzymatic reaction, which converts ATP into measurable light [1][4]. The testing process begins with surface sampling using a pre-moistened swab across a standardised area in a zigzag pattern and rotating the swab to maximise sample collection [3]. The swab returns to its sealed tube and an activating reagent releases from an internal compartment through a clicking or snapping mechanism [3].
The bioluminescent reaction proceeds in two distinct steps. Luciferin combines with ATP to produce luciferyl-adenylate and pyrophosphate in the first reaction [1][4]. The second step involves luciferyl-adenylate that reacts with molecular oxygen to yield oxyluciferin in an excited state plus carbon dioxide [1]. The excited oxyluciferin returns to ground state by releasing green to yellow luminescent light at 550-570 nanometres [1][4].
A luminometer measures light intensity and expresses results in relative light units (RLU) [3][5]. One RLU corresponds to one ATP molecule and creates a proportional relationship between light output and ATP quantity [3]. Luminometers provide results within 30 seconds of sample insertion [3][2]. Different manufacturers produce varying RLU readings for similar ATP concentrations, which means pass-fail thresholds must be established for each system [6].
Why ATP Works Well for General Cleanliness
Speed represents the main advantage of ATP testing methods. Results appear in minutes compared to the 24 to 48 hours that microbiological culture methods require [2][5]. This rapid feedback allows corrective action when cleaning fails to meet standards. Processing facilities measure cleaning effectiveness before production begins and prevent delays that reduce shelf life or necessitate recalls [6].
ATP monitoring detects food residues that visual inspection cannot identify [6]. Surfaces that appear clean to the naked eye may still harbour trace contamination invisible to operators [2]. Organic residues provide nutrients for bacterial growth and interfere with antimicrobial disinfectant activity [7]. These niche sites where cleaning removes food poorly can be identified to support continuous improvement of sanitation protocols [5].
Studies demonstrate ATP’s correlation with general microbiological hygiene in specific contexts. ATP swabs verified microbiological status or prompted additional cleaning in 86.8% of cases after cleaning and sanitation in one evaluation [5]. Common standard values include RLU thresholds below 250, though some facilities use 500, 100, or internal standards [3].
But ATP cannot distinguish between pathogenic and non-pathogenic microorganisms [3]. More critical for food allergen control programmes, ATP tests cannot detect allergenic proteins [7]. Surfaces that are disinfected but cleaned poorly may trigger ATP failures despite presenting no microbial risk, and allergen residues may remain undetected when ATP levels fall below threshold values.
Core Limitations of ATP Testing for Allergen Verification
ATP Does Not Detect Allergenic Proteins
Food allergens exist as proteins within specific food matrices. ATP, by contrast, functions as an energy molecule present in all living and once-living cells [8]. This fundamental biochemical difference creates an unsuitable analogy between ATP presence and allergenic protein residues. ATP testing cannot distinguish milk residue from lettuce debris or peanut contamination from rice particles [1]. The test responds to cellular material whatever the source, rendering it incapable of identifying the specific allergens that pose clinical risk to sensitive consumers.
The bioluminescent reaction detects adenosine triphosphate molecules across bacteria, yeast, mould and food debris universally [3]. Allergenic proteins may accompany these ATP sources or they may not. Surfaces can register acceptable RLU values and still harbour sufficient allergen protein to trigger adverse reactions in allergic individuals [1]. Conversely, substantial ATP readings may arise from non-allergenic organic matter that presents no allergen cross-contact risk. This disconnect between what ATP measures and what allergen control programmes need to verify creates limitations of ATP testing in allergen verification programmes.
Lack of Relation Between ATP Signals and Allergen Presence
Research exploring cleaning validation methods revealed major discrepancies between ATP test results and allergen-specific ELISA detection. High sensitivity ATP swabs detected milk powder and soy infant formula on stainless steel surfaces in one comparative study, yet ELISA methods returned negative results for these same samples [4]. Soy flour generated positive ATP readings on urethane and Teflon surfaces as well, but ELISA detected no allergen presence [4]. Whole egg powder on stainless steel and Teflon surfaces tested positive by ELISA but negative by sensitive ATP methods [4].
These contradictory outcomes demonstrate that ATP signals fail to predict allergen presence with any reliability. The protein-based allergen verification methods used in ELISA testing target allergenic proteins specifically, but ATP responds to total organic burden. Facilities that rely on ATP readings for allergen clearance decisions face substantial risk of releasing products with undeclared allergen contamination. Understanding these detection gaps becomes central when you establish evidence-based food allergen control protocols that withstand regulatory scrutiny.
Organisations managing high-risk allergen changeovers require verification tools that relate to clinical allergen thresholds directly. An allergen risk assessment helps identify where ATP testing creates verification gaps and where allergen-specific methods provide appropriate control.
Non-Allergenic Residues That Trigger ATP Responses
ATP testing responds to any organic material containing viable or recently viable cells. Bacterial contamination, biofilm development and residues from non-allergenic ingredients all generate measurable RLU values. A surface contaminated with sugar residue containing minimal protein may trigger ATP failures despite presenting no allergen risk whatsoever. Such false positive scenarios lead to unnecessary production delays and excessive re-cleaning without improving allergen safety outcomes.
The instrument-specific nature of RLU measurements compounds this limitation [1]. Different ATP systems assign varying threshold values, and no reliable conversion exists between RLU readings and actual micrograms of residue. Facilities cannot establish meaningful relations between ATP thresholds and relevant allergen levels using this measurement approach.
Allergen Residues That Remain Without ATP Detection
Refined food ingredients represent ATP’s failure to detect allergenic protein. Refined oils, sugars and starches contain minimal ATP yet may carry sufficient allergenic protein to pose clinical risk [1]. Peanut oil subjected to refining processes loses cellular ATP and potentially retains trace allergenic proteins. ATP testing would indicate cleanliness on surfaces contacted by such ingredients despite actual allergen presence.
Heat treatment and oxidising cleaning chemicals degrade ATP molecules but allergenic proteins persist [1]. Processing equipment exposed to thermal cycles or strong alkaline detergents may show reduced ATP signals even when protein residues remain intact. This degradation phenomenon creates false negative results where ATP testing approves surfaces that require additional allergen-focused verification. Understanding these visual allergen detection limitations helps facilities select appropriate verification methods for different allergen scenarios.
Scientific and Practical Constraints of ATP Allergen Testing
Detection Thresholds vs Clinically Relevant Allergen Levels
ATP devices report results in relative light units (RLU), which remain instrument-specific with no universal conversion to actual micrograms of residue [9]. This measurement limitation creates fundamental problems for allergen control programmes that just need quantifiable risk assessment. RLU cutoffs vary by system, matrix, and surface type. Facilities cannot set up meaningful correlations between ATP thresholds and allergen levels that matter clinically [9].
A surface can pass set ATP thresholds yet still harbour sufficient allergen to trigger adverse reactions in sensitive people [9]. Allergic consumers react to protein quantities measured in micrograms or milligrammes, not to arbitrary RLU values that reflect total organic burden. Quality assurance managers cannot translate ATP readings into applicable allergen risk data without reliable conversion factors. This data supports product release decisions and HACCP critical limit setup.
The disconnect between ATP testing thresholds and clinical allergen significance undermines the scientific justification that third-party audits need. Facilities that rely on ATP as main allergen verification face scrutiny when auditors question the evidence base linking RLU values to consumer safety outcomes. Allergen cleaning validation protocols demand verification methods that measure the actual hazard rather than surrogate indicators, notably.
Effect of Heat Treatment and Protein Denaturation
Heat processing alters ATP stability fundamentally whilst allergenic proteins often retain immunoreactivity. Studies that dissected bacteriostatic activity in bovine milk showed that heat treatment at 75°C for 30 minutes reduced native antibacterial proteins substantially [2]. The bacteriostatic capacity decreased with increasing heating intensity and correlated strongly with protein denaturation [2]. These denatured proteins may still trigger allergic responses in sensitive consumers, but.
ATP degrades readily through thermal exposure or oxidising agents and reduces signal intensity even when allergenic proteins persist [9]. Processing equipment subjected to cook cycles or hot caustic cleaning shows diminished ATP readings despite protein residues that remain intact on contact surfaces. This degradation phenomenon creates false security scenarios where surfaces appear clean by ATP standards but just need additional protein-focused verification.
Refined food ingredients represent this constraint well. Refined oils, sugars and starches contain minimal ATP due to processing yet may carry allergen protein with negligible ATP signal [9]. Equipment used for refined peanut oil processing would generate low RLU values despite potential allergenic protein transfer to subsequent production runs.
Surface Variability and Sampling Inconsistencies
Sampling area standardisation remains problematic across ATP test systems. The sampling area for swabbing lacks standardisation and creates inconsistencies in collected evidence [10]. Only one system provides specific instruction to swab a 10 x 10 cm area for typical flat surfaces [10]. Other manufacturers leave area determination to user discretion. This introduces operator variability that undermines data comparability.
Different ATP bioluminescence monitoring systems possess varying design features and capabilities [10]. ATP testing suffers from inherent variability that causes imprecision with ATP readings [11]. This variability undermines data validity from ATP testing allergens applications [11]. ATP contamination distributes unevenly on surfaces, so some swab portions contain higher concentrations than others [11]. Systems designed to read the swab tip produce variable results depending on which side presents to the optical sensor [11].
Cleaning Chemical’s Influence on ATP Readings
Disinfectants and sanitizers affect ATP signal reliability dramatically. Research that investigated eight different active compounds at various working concentrations found that three of five ATP detection systems showed almost no signal for at least half of tested disinfectants [5]. Inhibition of ATP detection became a substantial issue for three systems at highest recommended disinfectant concentrations [5].
Phenol-based formulations showed the highest quenching effect among tested disinfectants [10]. Chlorine, peroxyacetic acid, benzalkonium chloride and quaternary ammonium compounds all affected ATP readings to varying degrees [5]. Residues of disinfectant or sanitizers affect results severely and lead to incorrect conclusions about cleaning programme effectiveness [5].
Certain sanitizers can inhibit the reagent’s reaction and affect readings, furthermore [12]. Surfaces should be swabbed after rinsing or once disinfectant has evaporated to get accurate results [12]. This requirement conflicts with rapid verification needs in production environments where equipment turnaround times drive operational efficiency, but. Knowing these visual allergen detection constraints helps facilities develop layered verification strategies appropriate for different production scenarios.
False Positives and False Negatives in ATP Testing
When ATP Passes But Allergen Risk Remains
ATP testing allergen limitations show their most problematic side when surfaces register acceptable RLU values while harbouring clinically important allergen residues. Heat treatment or exposure to oxidising cleaning agents causes ATP degradation readily and reduces signal intensity even when allergenic proteins persist on equipment surfaces [13]. Then, processing lines subjected to thermal cycles or strong alkaline detergents may show diminished ATP readings despite intact protein residues that require additional verification through allergen cleaning validation protocols.
Refined food ingredients present another false security scenario. Low-ATP foods like refined oils, sugars and starches carry allergen protein with minimal ATP signal [13]. Equipment processing refined peanut oil generates negligible RLU values despite potential allergenic protein transfer to subsequent production runs. ATP testing standards provide false confidence that surfaces meet acceptable cleanliness criteria when actual allergen cross-contact risk persists in these cases.
Comparative testing data reveals the severity of this detection gap. Surfaces contaminated with mustard, peanut butter, cheese and bread—all major allergens—passed conventional ATP systems despite visible contamination levels [14]. These materials registered 0 to 375 RLU on standard ATP devices and fell within typical pass thresholds, while protein swab testing allergens methods detected substantial residues that required additional cleaning [14]. The implication remains clear: facilities relying on ATP testing allergens for verification may release products with undeclared allergen contamination.
When ATP Fails But No Allergen Risk Exists
ATP systems generate failures when non-allergenic organic residues contaminate surfaces. Food debris, bacterial contamination and biofilm development all produce measurable RLU values whatever the allergen content. Studies dissecting cleaning verification found that microbiological counts passed minimum sanitary requirements while ATP levels failed in 11.7% of cases [8]. These discrepancies arose from non-bacterial ATP sources like food residues detected by ATP but not representing allergen hazards.
Sugar residues illustrate this false positive scenario. Surfaces contacted by high-sugar, low-protein ingredients trigger ATP failures despite presenting negligible allergen risk. Such results prompt unnecessary production delays and excessive re-cleaning without improving allergen safety outcomes. Understanding these visual allergen detection limitations helps facilities distinguish between general hygiene concerns and specific allergen verification requirements.
Implications for Product Release Decisions
Quality assurance teams mistakenly equate ATP approval with allergen clearance and create substantial product release risks [15]. Facilities may proceed with processing despite surfaces remaining contaminated with allergenic proteins following acceptable ATP readings [16]. This false security undermines food allergen control programmes and exposes manufacturers to recall liability when undeclared allergens reach consumers.
Product release decisions based on ATP test systems cannot detect and measure specific allergens of concern. Such decisions remain scientifically unjustified during third-party audits. Regulatory expectations demand verification methods that measure actual allergen hazards rather than surrogate hygiene indicators increasingly, and this positions protein-specific detection as the appropriate evidence base for high-risk allergen changeovers.
Protein Detection Methods for Allergen Verification

Image Source: ProGnosis Biotech
Protein Detection Methods for Allergen Verification
Facilities that transition from ATP-based hygiene monitoring to allergen-specific verification need methods that detect allergenic proteins directly rather than surrogate cellular markers. Four principal methodologies address this requirement. Each offers distinct advantages for different verification scenarios within food production environments.
General Protein Swab Testing for Broad-Spectrum Detection
General protein swab systems detect total protein residues through colorimetric reactions based on the biuret method [17]. These devices function without targeting specific allergens. They identify protein presence across all residue types instead. AllerSnap swabs detect protein at concentrations as low as 3 μg after 30 minutes incubation [18][17]. ProClean systems identify 20 μg protein after 20 minutes at room temperature without requiring incubation [17].
The detection mechanism produces a purple colour change proportional to protein concentration [18]. Deeper purple indicates higher protein levels. Colour charts printed on product labels eliminate interpretation ambiguity. This broad-spectrum capability provides budget-friendly screening when you test for multiple surface allergens at once [18]. One swab verifies all proteins present and confirms surface hygiene without requiring separate allergen-specific tests for each potential contaminant.
General protein swabs work especially when you have no specific rapid test for certain allergens or when facilities need objective verification methods without extensive laboratory infrastructure [19]. But these systems cannot identify which specific allergen contributes to positive results. This limits their utility for targeted allergen cleaning validation programmes that require documented evidence of specific allergen removal.
Allergen-Specific Lateral Flow Devices
Lateral flow assays employ immunochromatographic principles to detect specific allergenic proteins within minutes [20][21]. The sample extract migrates along a membrane that contains antibodies conjugated to colloidal gold particles [20][1]. When target allergen proteins exist in the sample, antibody-allergen complexes form and produce a visible test line that confirms allergen presence [22].
InviRapid lateral flow systems provide qualitative results for food allergens in just a few minutes across food matrices, rinse waters and surface swabs [20]. Modern LFD systems incorporate hook lines that prevent false negative results at high allergen concentrations [21][1]. The hook line becomes attenuated or absent when very high allergen content exists. This makes the overload effect visible and reveals concentrations that might otherwise escape detection [21].
These rapid immunoassays deliver results in 5 to 15 minutes [17][1] and enable immediate cleaning verification decisions. The unified extraction protocol across multiple allergens simplifies workflow and training requirements [1]. Facilities that conduct allergen risk assessments benefit from LFD versatility across CIP solutions, working surfaces and food samples.
Lateral flow devices support HACCP programme integration through straightforward implementation in allergen sanitation management plans [20]. The absence of specialised equipment requirements positions these devices as practical tools for on-site allergen verification where laboratory access remains limited.
ELISA Laboratory Testing for Quantitative Results
Enzyme-linked immunosorbent assay represents the gold standard for quantitative allergen detection across all food products and processing environments [1][23]. The method delivers precise concentration data expressed in mg allergenic ingredient protein/kg food product, as recommended by FAO/WHO expert consultation [24]. ELISA’s high specificity and sensitivity enable trace-level quantification that supports regulatory compliance and risk assessment protocols [23].
The Allergen Shield ELISA series offers quantitative analysis of 22 allergens and employs monoclonal antibodies that minimise cross-reactivity [1]. Standardised 30-minute testing protocols across kits ensure consistency and ease of use [1]. Surface swabbing kits verify cleaning effectiveness and provide quantifiable evidence for validation studies [1].
ISO 17025-accredited laboratories should conduct testing using validated test methods with samples analysed in duplicate [24][4]. Proficiency test z-scores must remain at ≤±2 for quantitative methods [24]. This rigorous validation framework provides the evidence base required during third-party audits of allergen cleaning validation programmes.
Visual Detection Technology with Protein-Reactive Sprays
Protein-reactive spray systems employ colorimetric reactions that produce visible colour changes when protein residues contact the detection solution. These visual technologies allow immediate assessment across large surface areas without requiring individual swab collection points. They support rapid preliminary screening before you implement more specific verification methods for high-risk scenarios.
Why Protein Detection Is More Appropriate for Allergens

Image Source: ProGnosis Biotech
Direct Detection of Allergenic Protein Residues
Allergic reactions occur when immune systems recognise proteins in certain foods [25]. Therefore, protein-specific detection methods target the actual molecular hazard responsible for clinical symptoms. ELISA systems look for protein and provide quantitative results within a defined range [25]. They measure the allergenic substance itself rather than surrogate hygiene indicators. Protein-targeted immunoassays including ELISA and lateral flow devices detect allergenic proteins such as casein, gliadin, and Ara h 1 [13]. Test results correlate with consumer risk.
ATP bioluminescence responds to adenosine molecules across all cellular sources without allergen specificity. PCR testing faces similar limitations. It detects DNA from allergen sources rather than allergenic protein [25]. DNA does not equal allergenic protein, so PCR results require interpretation alongside protein-based findings [13]. So specific protein testing remains the only recognised method to identify and control allergen risk in food manufacturing [26].
Better Correlation with Actual Allergen Risk
Analytical methods detecting specific proteins prove more adequate when applied in allergen risk management [3]. Protein detection methods measure the molecular entity that triggers immune responses. Verification results correlate with clinical allergen thresholds. This relationship supports evidence-based decision-making within food allergen control programmes where quantifiable risk assessment determines product release acceptability.
ELISA methods achieve suitable detection levels measured in milligrammes per kilogramme [3]. Facilities can establish critical limits based on actual allergen concentration rather than arbitrary hygiene metrics. This quantitative capability distinguishes protein swab testing allergens approaches from ATP systems, which cannot detect and calculate specific allergens of concern.
Greater Relevance for Cleaning Validation Studies
Cleaning process validation requires quantitative ELISA methods as the recommended standard [25][3]. These immunoassays provide the scientifically justified evidence base demanded during third-party audits of allergen cleaning validation programmes. Following validation completion, qualitative lateral flow strips serve as simple, rapid, and affordable methods to monitor routinely [3].
Validation protocols must reference established laboratory methods with adequate sensitivity and specificity [27]. ELISA represents the most used approach to detect allergens, calculate quantities, and validate test methods [27]. Protein-based verification within evidence-based protocols for UK food safety audits provides the appropriate scientific foundation to control allergens.
When ATP Testing Remains Useful vs When to Avoid It
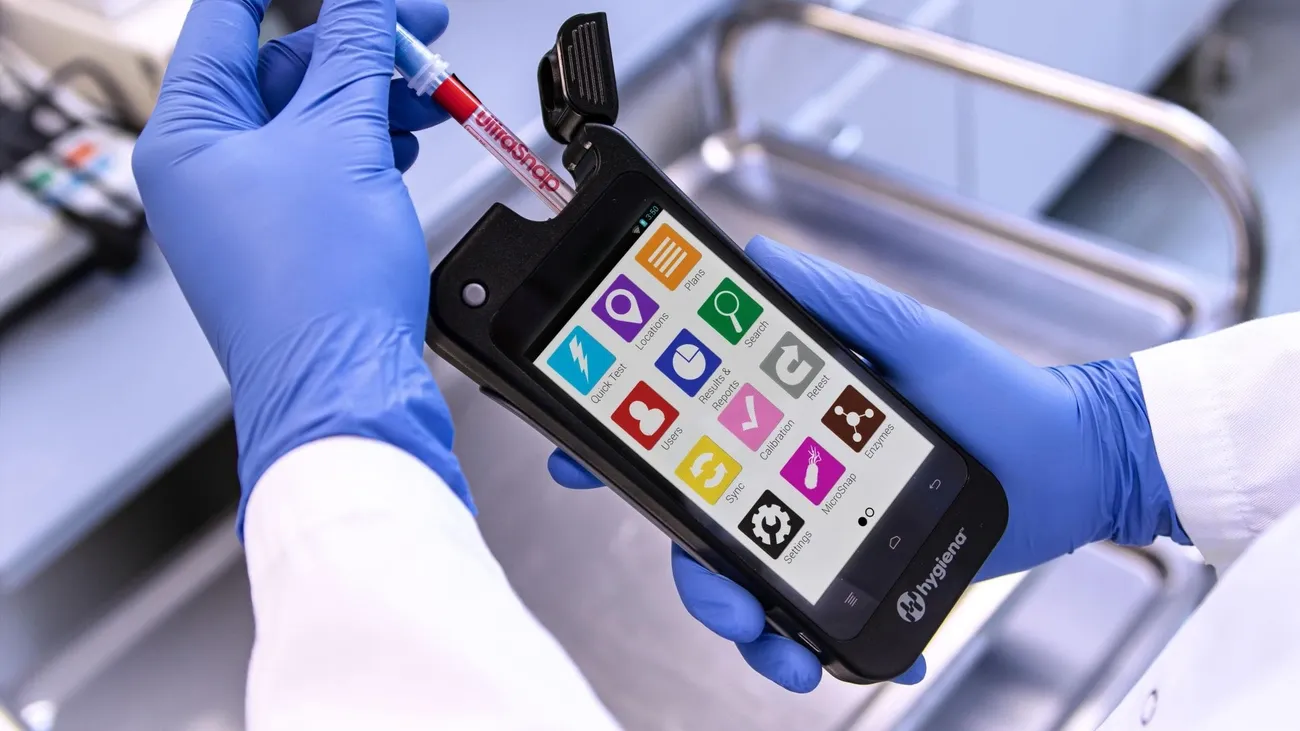
Image Source: Hygiena
Appropriate Uses: General Hygiene and Environmental Monitoring
ATP testing provides rapid, immediate verification of sanitation effectiveness. Food safety teams can identify areas harbouring contaminants after cleaning and take quick corrective actions [28]. Hygiene monitoring programmes benefit from ATP’s capacity to detect residual organic matter from microbial or product residues [29]. This supports pathogen and spoilage microorganism prevention [28]. Regular ATP monitoring generates substantial quantitative data. High-volume testing environments can identify proactive trends before failures occur [28].
Zone 2 indirect food contact surfaces especially benefit from ATP testing. The method addresses cross-contamination risks through environmental monitoring [28]. Pre-operational testing between cleaning and sanitation steps works best, since sanitizers function poorly on dirty surfaces [28]. This application supports sanitation standard operating procedures without requiring allergen-specific capabilities.
Pre-Screening Tool Limitations
Facilities may employ ATP as a supplementary tool among antibody-specific tests [9]. Reliance on ATP alone creates compliance gaps that become evident during GFSI audits and FSMA inspections [30]. The Food Allergy Research and Resource Programme guidance states this point: verify allergen sanitation procedures with ELISA testing first, then use ATP as ongoing monitoring within verified procedures [30]. ATP results fail to provide sufficient evidence of allergen removal under GFSI or FSMA allergen control programmes without documented correlation [30]. This correlation must show that surfaces passing ATP thresholds also pass ELISA allergen testing.
ATP Should Not Be Used for Allergen Decisions
Audited environments reject the use of only visual inspection and generic ATP testing allergens approaches for allergen verification unless risk remains low and documented well [31]. Visual inspection cannot detect low-level protein residues. ATP swabs detect organic matter broadly rather than allergen proteins [31]. Allergen changeovers require protein-based or allergen-specific tests through rapid kits or laboratory ELISA, at minimum during verification and often in routine verification for higher-risk transitions [31].
High-Risk Allergen Changeovers Requiring Specific Methods
Allergen changeover verification demands evidence that cleaning and line-clearance procedures remove allergenic residues to defined, risk-based levels when switching products [31]. Verification involves picking representative worst-case product pairs and equipment trains. Teams run defined cleaning changeovers and test surfaces, rinse waters, or product for allergen residues [31]. BRCGS Issue 9 now references A3-style monitoring for high-risk and allergen environments. This suggests conventional ATP testing allergens may no longer suit highest-risk surfaces under BRCGS facilities [30]. Selecting verification tools based on allergen risk within evidence-based protocols for UK food safety audits ensures methods withstand regulatory scrutiny.
Risk-Based Verification and Compliance Considerations
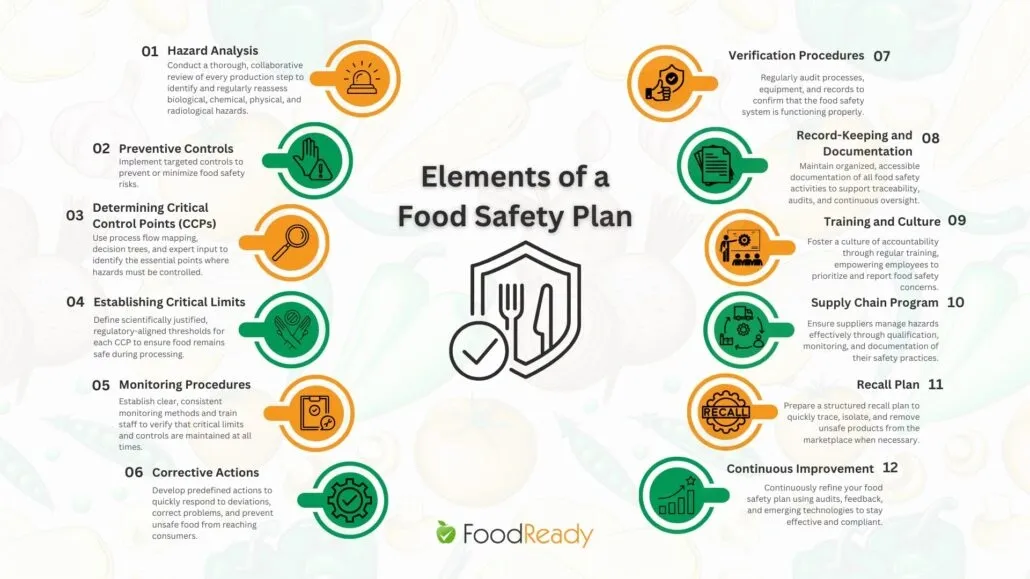
Image Source: FoodReady AI
Selecting Verification Tools Based on Allergen Risk
An allergen risk assessment structures analytical evaluation of where cross-contact could occur, how severe the risk appears, and which controls minimise that risk [2]. This HACCP-style hazard assessment focuses on allergenic proteins rather than microbial pathogens [2]. Risk factors include ingredient risks, process flow patterns, environmental facility risks, control effectiveness and testing verification protocols [2]. Quality managers deploy testing resources where they deliver maximum value. They focus on high-risk lines, raw materials and changeovers rather than universal testing [2].
Layered Verification Strategy and HACCP Integration
Allergen control programmes function as life-blood prerequisite programmes within HACCP food safety systems and address allergenic hazards [32]. These programmes require validation through cleaning verification, product testing, or evidence that controls prevent cross-contact above threshold levels [33]. Verification schedules reflect risk-based thinking. Higher-risk control points face more frequent verification than those controlling less severe hazards [33]. Documented procedures specify verification activities, frequency, responsible personnel and deficiency responses [33].
Audit Expectations for Methods with Scientific Justification
Auditors scrutinise whether allergen controls work through both validation and verification [11]. Validation provides proof that control measures can work. Verification confirms ongoing effectiveness [11]. Documentation requirements include validation study reports for allergen cleaning procedures, routine verification records, annual reassessment of allergen controls and supplier allergen specification reviews [11]. BRCGS expects formal systems managing allergens with written policies covering allergenic materials from raw material through finished product [34].
Common Industry Mistakes and Non-Conformities
When precautionary allergen labelling gets treated as a control measure, that represents a failure. PAL cannot substitute proper risk assessment and control [11]. Cleaning validation that relies on visual cleanliness fails because protein residues remain invisible [11]. When ATP hygiene monitoring gets confused with allergen cleaning validation, compliance gaps emerge. Facilities must verify with protein swab testing allergens methods or ELISA before employing ATP for routine monitoring [35]. Undocumented supplier changes and rework without traceability cause frequent non-conformities [11].
Conclusion
Relying on ATP testing to verify allergens creates substantial compliance gaps that third-party audits will challenge. ATP serves general hygiene monitoring well, but it cannot detect specific allergenic proteins or relate to clinically relevant allergen thresholds. Quality assurance managers must recognise that acceptable RLU values provide no guarantee of allergen removal.
Protein-based detection methods measure the actual molecular hazard that triggers allergic reactions, by contrast. ELISA and lateral flow devices deliver the scientific evidence required for allergen cleaning validation programmes. Facilities conducting allergen changeovers should implement risk-based verification strategies. These strategies employ allergen-specific testing rather than surrogate hygiene indicators. This approach revolutionises allergen control from assumption-based procedures into evidence-driven safety systems.
Key Takeaways
Understanding the critical limitations of ATP testing for allergen verification can prevent costly recalls and ensure proper food safety compliance in manufacturing environments.
• ATP testing measures cellular energy molecules, not allergenic proteins, creating dangerous gaps where surfaces pass hygiene tests but retain allergen contamination
• Protein-specific detection methods like ELISA and lateral flow devices directly measure allergenic hazards, providing scientifically justified evidence for regulatory compliance
• Heat treatment and cleaning chemicals degrade ATP signals whilst allergenic proteins persist, leading to false negative results that compromise consumer safety
• Risk-based verification strategies should employ allergen-specific testing for high-risk changeovers, reserving ATP for general hygiene monitoring only
• Third-party auditors increasingly reject ATP-only approaches for allergen validation, demanding protein-based evidence that correlates with actual clinical risk thresholds
The fundamental disconnect between what ATP measures (cellular material) and what allergen control requires (specific proteins) makes protein detection the appropriate choice for facilities serious about preventing allergen cross-contact and maintaining audit compliance.
FAQs
Q1. How do ATP tests differ from protein tests in detecting food contamination? ATP testing provides an indirect measure of contamination by detecting cellular energy molecules present in all organic matter, whilst protein testing directly measures the actual organic and microbial residues themselves. This fundamental difference makes protein detection more reliable for identifying specific contamination risks, particularly allergenic proteins that pose clinical hazards to sensitive consumers.
Q2. Can ATP testing reliably confirm that surfaces are free from allergens? No, ATP testing cannot reliably confirm allergen removal because it measures cellular material rather than allergenic proteins specifically. Surfaces may pass ATP thresholds whilst still harbouring sufficient allergen residues to trigger adverse reactions, or conversely, fail ATP tests due to non-allergenic organic matter that presents no allergen risk.
Q3. Are modern analytical methods capable of detecting allergens at clinically relevant levels? Yes, current analytical methods such as ELISA and lateral flow devices can detect major allergens including peanut, soy, hazelnut, and wheat at levels at or below established reference doses. These protein-specific methods achieve robust detection even in large serving sizes, providing the sensitivity required for effective allergen control programmes.
Q4. What is considered the most reliable method for allergen verification in food production? ELISA (enzyme-linked immunosorbent assay) represents the gold standard for allergen verification, providing quantitative results that measure specific allergenic proteins. This method delivers the scientifically justified evidence required for cleaning validation studies and regulatory compliance in food manufacturing environments.
Q5. Why do auditors reject ATP testing as the sole method for allergen control? Auditors reject ATP-only approaches because ATP cannot detect or quantify specific allergens, creating compliance gaps under GFSI and FSMA requirements. Facilities must validate allergen removal using protein-based methods like ELISA before employing ATP for routine hygiene monitoring, ensuring verification tools correlate with actual allergen risk rather than general cleanliness.
References
[1] – https://www.prognosis-biotech.com/news-events/the-science-of-allergen-detection-lateral-flow-and-elisa-explained/
[2] – https://www.neogen.com/en/usac/neocenter/blog/allergen-risk-assessment-when-to-use-test-kits/?srsltid=AfmBOorDDjH8nDyzUPEd93XlciN_srv1xWtGRmkzGxj7PcQlEg8DVl6v
[3] – https://www.sciencedirect.com/science/article/abs/pii/S0956713516306557
[4] – https://www.rssl.com/insights/food-consumer-goods/food-allergen-detection-choosing-the-right-testing-method/
[5] – https://www.sigmaaldrich.com/deepweb/assets/sigmaaldrich/marketing/global/documents/102/370/atp-testing-in-food-industry-an12922en-ms.pdf?srsltid=AfmBOorqAEw_sOmzanS7hzmsq6eJKsKhvT9p4cCtA6JM4MZVKiw7iYlW
[6] – https://www.neogen.com/en/usac/neocenter/blog/your-guide-to-atp-testing/?srsltid=AfmBOop8qkIzG_2GSQsgxoJ-HgEzUrqf8YRH3A0iesdWn6R148lf5um1
[7] – https://www.sciencedirect.com/science/article/pii/S0362028X22067102
[8] – https://pmc.ncbi.nlm.nih.gov/articles/PMC8090886/
[9] – https://www.rochestermidland.com/blog/checklist-9-considerations-for-allergen-control-in-the-food-industry/
[10] – https://www.nss.nhs.scot/media/4227/atp-and-fluorescent-markers-literature-review-v2.pdf
[11] – https://pinkpepper.io/articles/allergen-management-within-haccp-plans
[12] – https://www.klipspringer.com/blogs/qa-beyond-atp-the-next-generation-of-reliable-hygiene-verification/
[13] – https://www.romerlabs.com/en/library/knowledge/detail/why-atp-isnt-a-substitute-for-allergen-verification
[14] – https://www.klipspringer.com/blogs/allergen-testing-and-the-a3-system-everything-you-need-to-know/
[15] – https://www.linkedin.com/posts/dr-asad-shafique-784a85218_atp-tests-do-not-detect-allergenic-proteins-activity-7402401209661329412-kTBb
[16] – https://www.klipspringer.com/wp-content/uploads/2024/01/A3_ATP_Depletion_the-risk-of-false-negative.pdf
[17] – https://labtekservices.co.uk/surface-testing-for-food-safety/
[18] – https://www.hygiena.com/food-safety/allergen-detection/general-protein/allersnap
[19] – https://www.neogen.com/en/usac/neocenter/blog/atp-protein-and-allergen-testing-in-production-facilities-which-should-you-use/?srsltid=AfmBOoodhbUkZk9wd9GUbV1dQO9nQ7GtRZHbj4zsnduAcahJDomHe67k
[20] – https://www.invitek.com/en/allergen-detection/allergen-lateral-flow-assays
[21] – https://food.r-biopharm.com/highlights/rapid-allergen-testing/
[22] – https://blog.invitek.com/articles/foodsafetyintegrity/food-allergen-testing-should-you-use-elisa-pcr-or-lfa-methods
[23] – https://www.hygiena.com/learning-centre/technology-guide/elisa-in-food-safety-testing-a-complete-overview
[24] – https://www.food.gov.uk/research/review-of-allergen-analytical-testing-methodologies-allergen-testing-workflows-to-support-incident-management
[25] – https://www.rssl.com/insights/food-consumer-goods/designing-a-successful-allergen-cleaning-validation-strategy/
[26] – https://www.neogen.com/en/usac/neocenter/blog/atp-protein-and-allergen-testing-in-production-facilities-which-should-you-use/?srsltid=AfmBOopKL12R9Sd6gfUXC347wPt9dbvHjQl8xb-5hJX8CtOEgdk-yKxR
[27] – https://www.hygiena.com/documents/68351/allergen-detection-in-food-safety—analysis–application.pdf
[28] – https://www.neogen.com/en/usac/neocenter/blog/your-guide-to-atp-testing/?srsltid=AfmBOoouBkIcUKNQq06LT1W6G1DvgN0WL8GelC9HvG-uvJoX7QsQmPB7
[29] – https://il-biosystems.com/knowledge/make-confident-sanitation-decisions-with-atp-monitoring/
[30] – https://www.alleratech.com/blog/atp-testing
[31] – https://sgsystemsglobal.com/glossary/allergen-changeover-validation-consumer-products/
[32] – https://www.fooddocs.com/post/haccp-allergen-control-programme
[33] – https://foodindustryhub.com/fsqms-guide/validating-the-haccp-plan-and-establishing-verification-procedures/
[34] – https://www.fooddocs.com/post/allergen-management
[35] – https://www.qualityassurancemag.com/article/common-errors-in-allergen-management/