
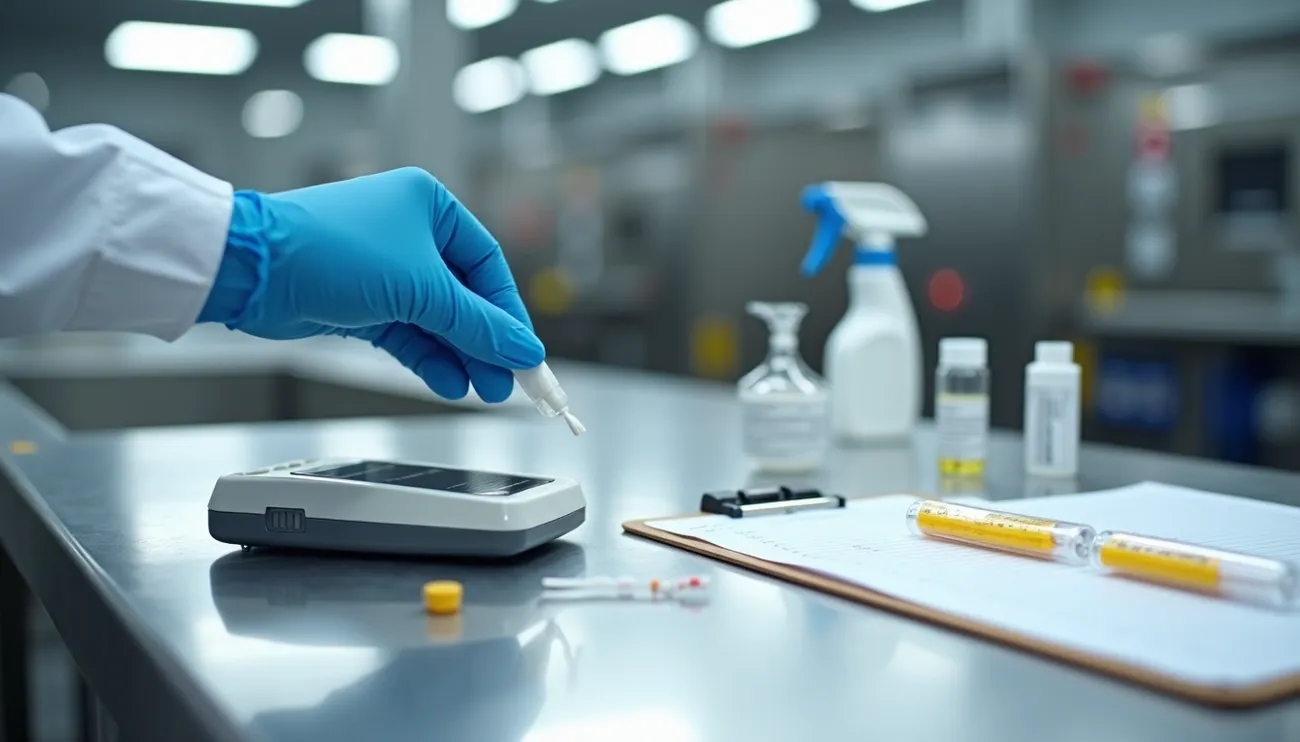
 ATP testing allergens in food manufacturing environments is a common practise, yet using an ATP test to detect food allergens will yield unreliable results. While ATP-based bioluminescence detects organic residue, it cannot identify allergenic proteins. Diagnostic tests for allergens have greater sensitivity for the detection of allergen proteins at trace levels because they are designed for allergens unlike a general ATP test. This piece gets into the scientific limitations and practical integration of ATP testing within allergen control programmes.
What Is ATP Testing and How Does It Work
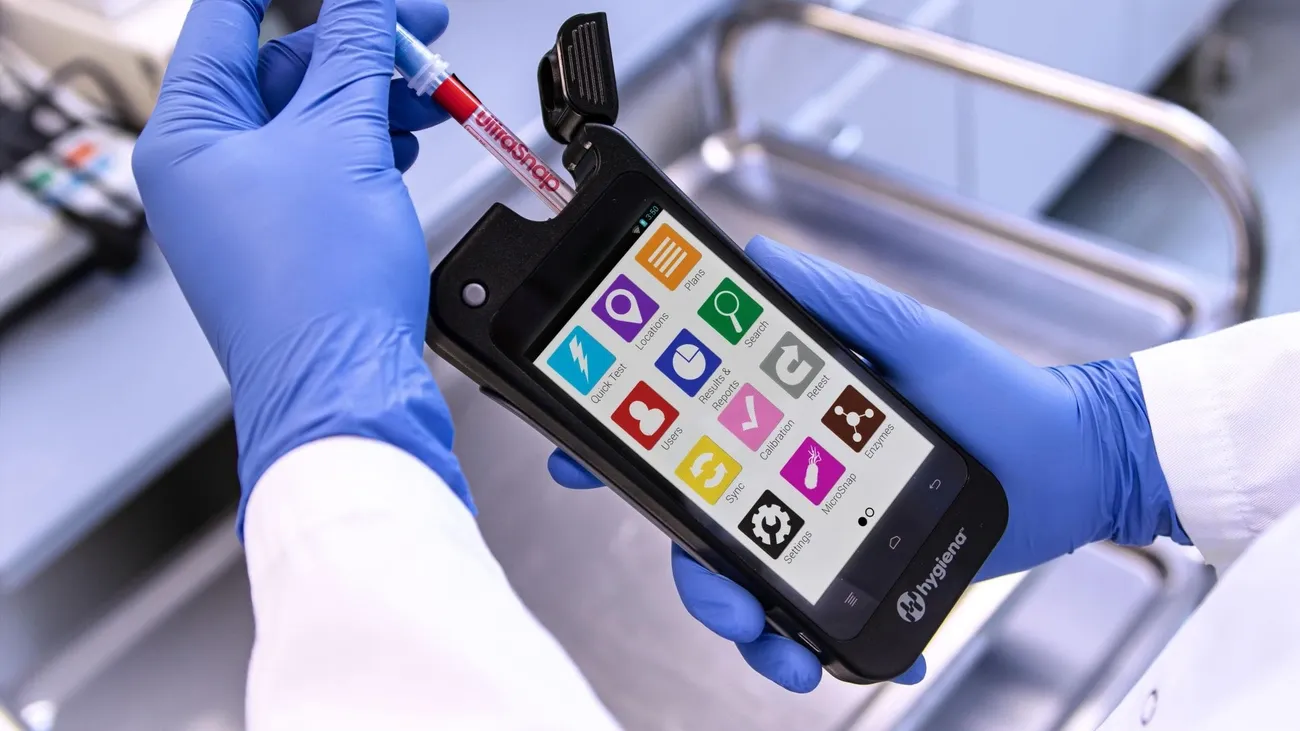
Image Source: Hygiena
Understanding adenosine triphosphate in living cells
Adenosine triphosphate serves as the primary energy currency in all living organisms. This nucleoside triphosphate stores energy within high-energy phosphate bonds that power cellular processes like muscle contraction, nerve impulse propagation and chemical synthesis [1]. ATP consists of three components: an adenine base, a ribose sugar and a triphosphate group [1]. The energy release occurs when ATP hydrolyses to adenosine diphosphate (ADP) or adenosine monophosphate (AMP) and yields about 30.5 kJ/mol of free energy [1].
The molecule exists predominantly in metabolically active cells. ATP synthesis stops when cells die. The existing ATP pool degrades faster [2]. This characteristic makes ATP an effective marker for viable cells in all organisms, from bacteria to human tissue [1]. Living cells maintain ATP concentrations between 1-10 μM [1]. The human body hydrolyses 100-150 moles of ATP daily to sustain normal cellular functions [1].
ATP production occurs mainly through cellular respiration in the mitochondrial matrix and generates about 32 ATP molecules per glucose molecule oxidised [1]. The cell replenishes ATP through metabolic pathways that include glycolysis, the citric acid cycle and oxidative phosphorylation [1]. This constant turnover means ATP presence signals active biological material. Its absence indicates cellular death or non-viable organic matter.
The bioluminescence technology behind ATP detection
ATP testing exploits the firefly luciferase enzymatic reaction to measure biological contamination. The luciferin-luciferase complex produces measurable light when exposed to ATP through a two-step biochemical process [1]. Luciferase catalyses the adenylation of luciferin using ATP to form luciferyl-adenylate and pyrophosphate [1]. This luciferyl-adenylate reacts with molecular oxygen to yield oxyluciferin in an electronically excited state plus carbon dioxide [2].
The excited oxyluciferin returns to its ground state by releasing green to yellow bioluminescent light at wavelengths between 550-570 nm [1]. A luminometer measures this light emission as relative light units (RLU) [1]. The light intensity associates with ATP concentration. The RLU value reflects the quantity of ATP-containing material present on the tested surface [1].
Commercial ATP testing systems employ swabs to collect samples from surfaces. The swab releases reagents containing the luciferin-luciferase enzyme complex upon activation [1]. The reaction occurs within seconds and produces bioluminescence proportional to the ATP collected [1]. Higher RLU readings indicate greater levels of organic contamination, whether from microorganisms, food residues or other biological sources [1].
RLU values vary between manufacturers. A reading of 10 RLU from one system may be similar to 50 RLU from another [1]. Then pass-fail thresholds must be established for each testing platform. Modern bioluminescent assays utilise stabilised recombinant luciferase that maintains activity for hours rather than seconds and allows batch processing of multiple samples [2].
Why ATP testing became standard for hygiene monitoring
ATP testing originated with NASA in 1974 as a method to detect extraterrestrial life [1]. The technology found commercial application in the food industry as a cleaning verification tool over the subsequent three decades [1]. The method gained traction because it addresses fundamental limitations of culture-based microbiological testing.
Culture methods require 24-72 hours for results and delay corrective actions when contamination occurs. ATP testing delivers results within minutes and enables immediate response to hygiene failures [1]. This speed proves especially valuable in high-volume production environments where equipment must return to service after cleaning.
The technology detects ATP from all sources because ATP structure remains constant in all cellular life [1]. Food processing environments contain ATP from microorganisms, food residues and other organic matter [1]. This broad sensitivity helps identify locations where food particles remain after cleaning and create potential harbours for microbial growth [1].
ATP testing provides verification for facilities that lack sophisticated laboratory capabilities. The portable luminometers require minimal technical training compared to microbiological culture techniques [1]. Regular testing generates quantitative data sets that reveal contamination trends before failures occur [1].
ATP monitoring shares certain limitations with culture-based methods. These include sampling biases related to swabbing patterns and surface characteristics [1]. Cleaning and sanitation compounds may interfere with the assay or degrade ATP before detection [1]. The method cannot detect bacterial spores [1]. Periodic microbial testing should supplement ATP programmes to verify sanitation effectiveness for these reasons [1].
ATP Testing in the Food Industry
Role in cleaning verification programmes
Food manufacturing facilities worldwide conduct over 50 million ATP tests annually, making it one of the most accessible hygiene verification methods across the sector [1]. The technology functions as a line of defence within sanitation programmes by converting invisible organic residues into quantifiable data [1]. Pre-operational verification represents the most common application. Surfaces undergo ATP testing after cleaning completion but before production commences [1]. Quality teams can confirm surface readiness at this point and verify that cleaning-in-place cycles achieved intended sanitation outcomes before the production line restarts [1].
ATP verification lines up with regulatory frameworks including HACCP, FSMA, and GFSI programmes [1]. The FDA expresses environmental monitoring under FSMA, where ATP provides rapid sanitation verification used alongside microbiological monitoring where required [1]. Quality assurance managers establish site-specific RLU thresholds that define pass-fail criteria. They compare test results against these predetermined limits to determine whether a surface meets production readiness standards [1]. Auditors expect documented rationale for threshold selection and systematic coverage strategies rather than ad hoc testing of familiar surfaces [1].
Post-sanitation trending serves a different function from immediate go-no-go decisions. Facilities collect ATP data over time to assess whether cleaning validation processes maintain consistent performance, improve or degrade [1]. This trending approach separates simple ATP programmes from those that streamline corrective action and long-term hygiene performance improvements [1].
Speed and practicality for production environments
ATP testing delivers results in about 10 to 15 seconds and enables immediate corrective action when sanitation failures occur [1][1]. This rapid turnaround addresses the operational need to determine cleaning effectiveness quickly so food manufacturing can begin without delays [2]. The speed advantage becomes valuable especially in high-volume production environments where equipment downtime affects output and profitability directly.
Visual inspection alone cannot identify microscopic residues that ATP testing detects objectively and reliably [2]. Microbiological culture testing requires hours to days for results, rendering it impractical for pre-operational verification decisions [2]. ATP testing fills this gap by providing measurable, quantitative assessment of cleanliness within the timeframe production schedules just need [1].
A test that produces a failing result requires documentation within the quality system. Recleaning and retesting must follow until a passing result occurs [2]. This immediate feedback loop allows sanitation teams to address contamination before food contact occurs. Independent research demonstrates that ATP hygiene monitoring identifies high-risk zones more reliably than visual checks alone and drives faster corrective action [1].
Use in environmental hygiene monitoring systems
Zone-based frameworks provide the risk-based structure that regulatory auditors expect within environmental monitoring programmes [1]. ATP testing targets Zone 1 product contact surfaces, though smaller facilities with limited microbiological testing capabilities may extend ATP use to Zone 2 indirect contact surfaces [2]. This systematic approach replaces unstructured swabbing patterns that lack documented rationale or complete coverage [1].
The advancement from conventional ATP tests to A3 testing addresses limitations caused by ATP hydrolysis to ADP and AMP. The A3 test detects ATP+ADP+AMP collectively and improves detection of adenylates from food residues while providing more reliable hygiene verification [1]. When used alongside methods such as microorganism culture and food allergen testing approaches, the A3 test supports identification of contamination sources and helps effective hygiene management [1].
ATP monitoring combined with microbiological evaluation provides reliable verification of sanitation standard operating procedures. Data from combined programmes shows that ATP swabs taken after cleaning would verify microbiological hygiene status or trigger additional cleaning in 86.8% of cases correctly [2]. The strongest environmental monitoring programmes use ATP for daily pre-operational verification whilst reserving microbiological testing for periodic programme validation and incident investigation [1]. This layered approach balances the up-to-the-minute feedback ATP provides with the specificity that culture-based methods offer for identifying particular microbial hazards.
Can ATP Testing Detect Allergens
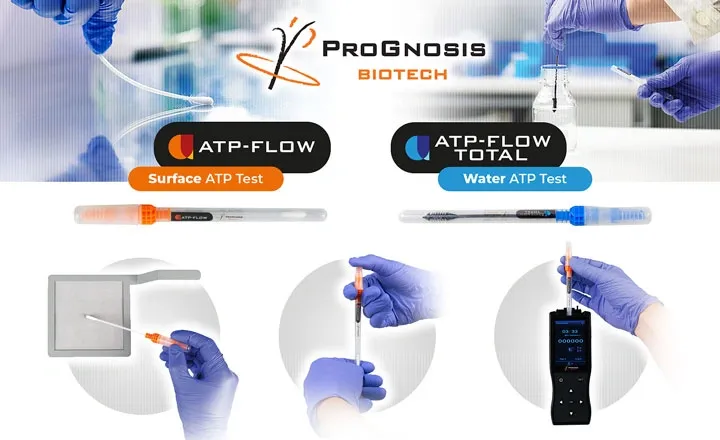
Image Source: ProGnosis Biotech
What ATP testing actually measures
ATP detection systems measure luminescent signals reported in relative light units that relate to biological residues on surfaces [1]. These systems identify the presence of organic residue, including food particles containing proteins, fats, carbohydrates and sugars, among microbial cells such as bacteria, yeast and mould [2]. The test responds to ATP from any source because ATP structure remains similar across all cellular life forms [3].
ATP testing reveals whether organic matter remains after cleaning. Yet it cannot separate different contamination sources [1]. A reading of 100 RLU might originate from milk protein, lettuce residue, peanut particles or rice starch [1]. This non-specificity creates fundamental limitations for allergen cleaning validation purposes where you need to identify specific allergenic proteins.
RLU measurements lack universal mass units [1]. Different luminometer systems report instrument-specific values with no reliable conversion to micrograms of residue [1]. Pass-fail thresholds vary by system, matrix and surface type [1]. Two facilities that use different ATP platforms cannot compare RLU results directly. This complicates standardisation efforts across manufacturing sites.
The relationship between organic residue and allergen presence
Residues of allergenic foods on surfaces may increase the risk of allergen cross-contact [4]. Food allergens consist of proteins, yet ATP abundance in living and once-living cells means ATP presence does not reliably indicate allergenic protein on a surface [5]. The link between ATP levels and allergen presence remains weak and inconsistent [6].
ATP degrades readily through heat exposure or oxidising agents. This reduces the luminescent signal even when allergenic proteins persist [1]. Thermal processing and chemical cleaning agents denature proteins whilst destroying ATP molecules at the same time. A surface exposed to high-temperature cleaning may harbour sufficient allergen to trigger clinical reactions despite returning a passing ATP result.
Low-ATP foods such as refined oils, sugars and starches can carry allergen protein with minimal ATP signal [1]. These processed ingredients contain negligible viable cells, hence little ATP, yet they may contain extracted allergenic proteins. Wheat starch produces low RLU readings whilst carrying residual gluten proteins potentially.
Situations where ATP provides useful indicative data
ATP testing serves as a proxy measure of proteins at levels that could indicate allergen presence [3]. The technology identifies gross contamination and general organic soiling that suggests inadequate cleaning. When ATP testing reveals elevated RLU values after cleaning, it signals residual organic matter that requires attention before production proceeds.
The A3 test, which detects ATP+ADP+AMP together, demonstrates effectiveness in detecting the risk for allergen cross-contact after inadequate cleaning [7]. Field studies in food processing plants show that A3 and milk protein levels decrease together as cleaning progresses [7]. This parallel reduction suggests A3 testing can support allergen verification programmes when integrated appropriately [7].
ATP testing proves valuable for routine hygiene verification and trend monitoring. The method identifies areas where food debris persists and creates potential harbours for allergen residues. Rather than confirming allergen absence, ATP indicates whether surfaces meet general cleanliness standards that reduce cross-contact risk.
What ATP testing cannot tell you about allergens
ATP testing does not identify specific allergenic proteins [2]. A surface may return a passing ATP threshold yet still harbour enough allergen to matter clinically [1]. The method cannot separate milk protein from lettuce, nor distinguish peanut residue from rice [1]. This limitation renders ATP unsuitable as primary evidence of allergen removal [1].
Viruses contain nucleic acids but carry no ATP [2]. Norovirus and hepatitis A produce no elevated RLU readings, meaning ATP testing provides zero detection coverage for viral contamination [2]. Bacterial spores contain minimal metabolically active ATP and evade detection at typical luminometer sensitivity levels [2].
Surfaces exposed to aggressive cleaning protocols may carry degraded adenylates (ADP and AMP) that conventional ATP tests report as clean [2]. Heat, acids and enzymatic cleaning activity degrade ATP whilst allergenic proteins remain intact. ATP can then indicate “clean” status whilst allergen risk persists [1]. Programmes must rely on allergen-specific methods to verify cleaning and control, using ATP only as a complementary tool for general hygiene monitoring [1].
Scientific Limitations of ATP for Allergen Detection
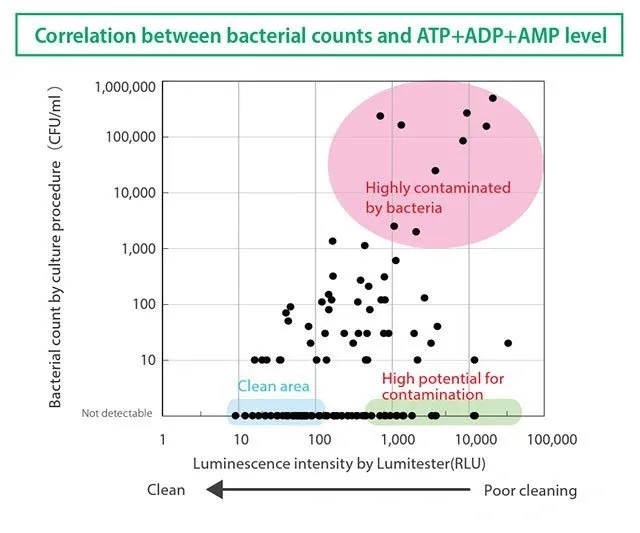
Image Source: Klipspringer
The scientific foundation behind these limitations reveals fundamental incompatibilities between ATP bioluminescence chemistry and allergen detection requirements. Food allergens consist of proteins found in foods, yet ATP is abundant in all living and once-living cells. This makes it an unreliable indicator of allergenic protein presence on surfaces [8]. The biochemical mismatch creates systematic detection failures in multiple scenarios.
ATP does not detect allergenic proteins with any specificity
ATP testing cannot distinguish milk protein from lettuce residue, nor tell apart peanut particles from rice starch [9]. An ATP reading confirms organic residue exists without identifying its source. Allergen tests possess greater sensitivity for detecting allergen proteins at trace levels because they target particular proteins rather than universal cellular energy molecules [8]. ELISA-based methods employ antibodies that capture allergen proteins while filtering out unnecessary proteins. They deliver specificity that ATP cannot provide [8].
Allergenic proteins present without ATP signal
ATP degrades through heat exposure or oxidising agents and reduces luminescent signals even when allergenic proteins persist [9]. Thermal processing and chemical cleaning agents destroy ATP molecules while proteins remain intact. Low-ATP foods including refined oils, sugars and starches carry allergen protein with minimal ATP signal [9]. These processed ingredients contain negligible viable cells and hence little ATP, yet may harbour extracted allergenic proteins sufficient to trigger clinical reactions. ATP testing for allergens appears clean in this situation while allergen risk remains present.
Non-protein residues triggering ATP results
Surfaces contaminated with non-allergenic organic matter produce elevated RLU readings. Bacteria, yeast, mould and non-allergenic food residues all contain ATP that triggers bioluminescent reactions. A surface may fail ATP thresholds due to microbial contamination or benign food debris while remaining allergen-free. This creates false risk signals unrelated to allergen cross-contact concerns.
Variability between different food types and residues
Detection sensitivity varies by a lot between food matrices. The A3 test demonstrated lower detection limits than conventional ATP testing, with greater sensitivity than protein swab tests except when applied to gelatin [8]. Detection limits of the A3 test proved comparable to lateral flow immunoassays for crustacean shellfish and processed grains, excluding wheat flour and buckwheat [8]. During surface testing with mustard, peanut butter, hazelnut, soy beans, shrimp, scallops, sardines, yoghurt, cheese, chocolate, ice cream and bread, only A3 systems generated fail results with consistency. ATP systems passed visibly contaminated surfaces on a regular basis [5].
False positives and false negatives explained
Protein denaturation through thermal processing or chemical exposure compromises protein test results, yet residues remain [5]. ATP systems miss ADP and AMP from food debris degradation and pass surfaces that require further cleaning [5]. These systematic errors occur because ATP measurement and allergen presence follow independent biochemical pathways.
Detection thresholds versus allergen risk thresholds
Site RLU thresholds define hygiene acceptability, yet these values bear no relationship to allergen clinical thresholds. A surface passing at 100 RLU may contain sufficient allergen to trigger reactions in sensitised individuals. Allergen cleaning validation requires detection methods fine-tuned to parts-per-million allergen protein levels, not relative light units measuring total adenylates.
Comparison With Other Verification Methods
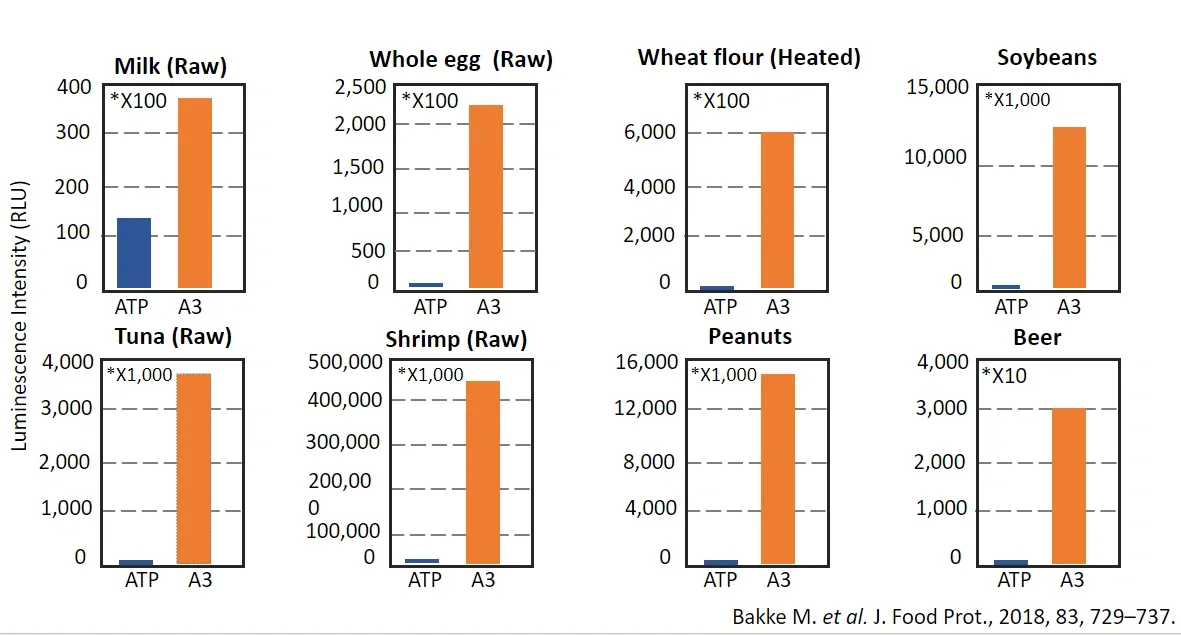
Image Source: Klipspringer
Manufacturing facilities employ multiple verification methods beyond ATP. Each offers distinct capabilities and limitations when assessing cleaning effectiveness. Knowing how these methods compare helps facilities select appropriate tools for specific verification needs.
Visual inspection limitations
Visual inspection serves as the first-line assessment in cleaning verification and requires equipment surfaces to be free of visible residues [10]. Regulatory frameworks including FDA 21 CFR Part 211.67 and EMA Annexe 15 recognise visual cleanliness as critical for equipment hygiene verification [11]. But operators performing visual inspection require specific training because detection varies with distance, angle, lighting conditions, surface characteristics and individual visual acuity [10].
The threshold at which residues become visible ranges between 1-4 µg/cm² depending on the residue type and viewing conditions [12]. Visual inspection alone cannot reliably detect microscopic residues that may still pose allergen cross-contact risks. So visual examination identifies gross contamination failures but lacks sensitivity for trace-level allergen verification where detection limits nowhere near visual thresholds matter clinically.
Protein-based swab tests
Protein swab tests provide qualitative or semi-quantitative cleanliness indication by detecting protein residue through the biuret reaction and produce colour changes that reflect protein levels present [4]. These tests detect approximately 20 µg of protein after 20 minutes at room temperature, while some high-sensitivity variants detect 3 µg of protein after 30 minutes incubation [13].
Protein-based swab tests cannot differentiate between protein sources. Any protein triggers positive results, whether from peanut, wheat, chicken or non-allergenic sources [2]. Comparative testing revealed that A3 systems showed superior sensitivity for 35 products among 40 allergens tested, with protein swabs proving more effective only for gelatin detection [14]. This limitation renders protein swabs unsuitable as primary allergen verification tools, though they support general hygiene monitoring programmes.
Allergen-specific rapid tests (lateral flow and ELISA)
Lateral flow immunoassays deliver rapid allergen screening on production floors within 10-15 minutes and require minimal training and no laboratory equipment [15]. These tests detect specific allergenic proteins including walnut at 0.1 μg on working surfaces and 1 µg/g in food matrices [16]. Sandwich ELISA methods achieve even greater sensitivity and detect 0.5 µg/g walnut protein in complex foods with recovery rates between 71-97% [16].
ELISA testing provides quantitative allergen measurement in parts-per-million and supports analytical release decisions and regulatory compliance documentation [17]. Results become available within 100 minutes for standard ELISA protocols [15]. Lateral flow tests suit immediate pass-fail decisions during changeovers, while ELISA supports validation activities that require precise allergen quantification.
Laboratory testing as the gold standard
ELISA represents the gold standard for allergen testing in finished products and delivers high sensitivity, specificity and quantitative results that regulatory programmes require [17]. PCR-based methods detect allergen traces at 0.1-1 ppm in complex matrices including spices and chocolate [15]. These laboratory methods provide definitive allergen confirmation that supports allergen cleaning validation studies and product release decisions where ATP or protein testing cannot deliver the specificity required.
When ATP Testing Is Appropriate for Allergen Control
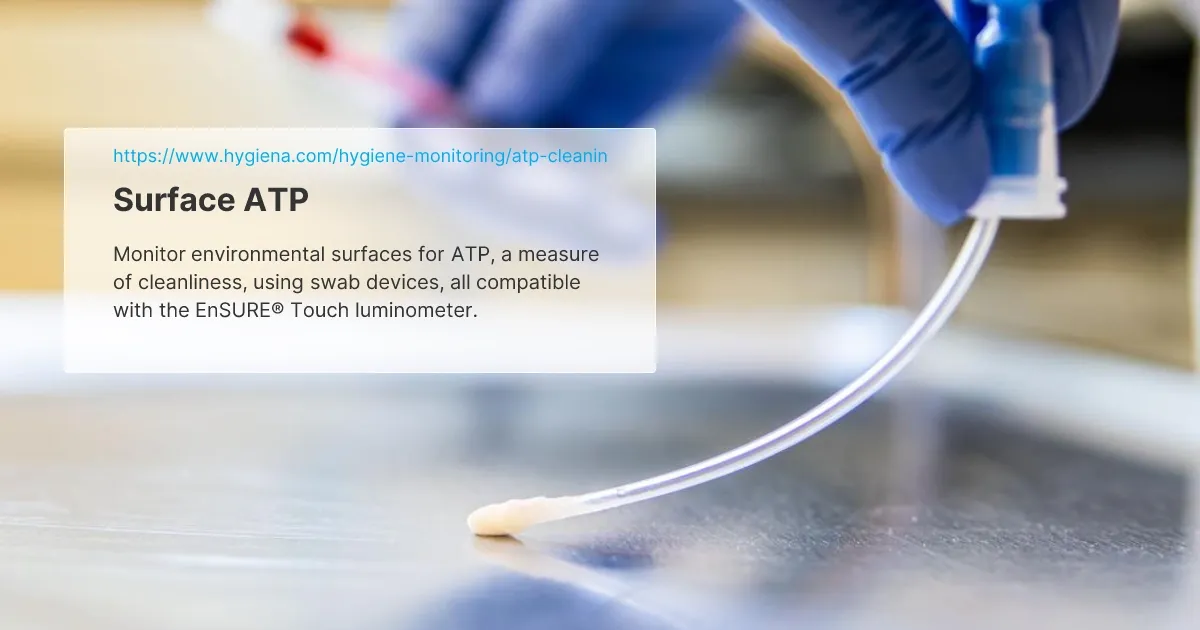
Image Source: Hygiena
Despite scientific limitations for allergen-specific detection, ATP testing serves legitimate functions within broader allergen control strategies when applied and understood the right way.
Routine hygiene verification and trend monitoring
Regular ATP testing generates large volumes of quantitative data and facilitates proactive identification of trends in high-volume testing environments before failures occur [3]. This trending capability distinguishes simple hygiene monitoring from sophisticated programmes that push continuous improvement forward. ATP provides measurable and objective assessment of equipment and surface cleanliness before food processing or preparation [3]. Many processing facilities measure cleaning practise effectiveness to ensure production can begin safely [3].
Knowing how to trend and analyse generated data over time provides better understanding and control of facility hygiene and production processes [3]. Quality teams get into ATP results across weeks and months and identify patterns that signal emerging sanitation problems. Personnel with process knowledge should break down repeated fail or caution results as a priority and implement appropriate preventive actions [3]. This analytical approach supports allergen cleaning validation verification programmes by establishing baseline hygiene performance against which allergen-specific testing results can be interpreted.
Identifying gross contamination
ATP systems identify contamination beyond visual inspection capabilities and eliminate human error while detecting contaminated surfaces that visual assessment misses [18]. Higher probability of microorganisms occurs where ATP exists [18]. Surfaces failing ATP thresholds require recleaning before reswabbing and result in lower ATP levels [18]. This immediate feedback addresses gross contamination scenarios where substantial organic residue signals inadequate cleaning that could harbour allergen proteins alongside microbial contamination.
Supporting allergen verification programmes
ATP swabs function during ongoing verification when documented to perform well during validation processes [1]. But facilities should not rely on ATP swabs alone for allergen cleaning verification since ATP exists in most foods and lacks specificity for allergens [1]. The A3 system strengthens allergen control programmes by detecting all organic residue and supporting other testing conducted on-site, though it does not test for allergens directly [5].
Setting site-specific RLU thresholds
Facilities establish thresholds specific to each location given unique combinations of personnel, equipment, cleaning chemicals, procedures and products [6]. Pass thresholds represent the range of scores resulting from successful cleaning completion [6]. Validation requires monitoring cleaning processes through ATP measurements over several days or weeks and getting at least six to ten samples per test site [6]. Typical acceptable limits for food contact surfaces range from 200 to 500 RLU, though exact values require site-specific validation [19].
When ATP Should Not Be Relied Upon
Certain operational scenarios just need allergen-specific verification methods where ATP testing for allergens produces inadequate evidence for safety decisions. Regulatory compliance and consumer protection need definitive allergen confirmation in these contexts.
High-risk allergen changeovers
ATP tests do not single out allergen proteins. Facilities should use them only as supplements to antibody-specific tests [20]. Verification tests should happen for every changeover with high-risk products [20]. Relying on visual inspection alone for high-risk allergen changes represents indefensible practise, especially when you have nut, milk, egg or gluten-free claims [21]. Many organisations need allergen-specific tests to comply with the Food Safety Modernisation Act or internal standards [22].
Validation studies that need allergen-specific data
Facilities should use quantitative ELISA methods to confirm sanitation specific for the allergen to be measured [7]. Quantitative peanut ELISA kits deliver increased specificity and sensitivity versus total protein or ATP swabbing approaches when confirming peanut absence, to name just one example [7]. Complete risk assessments covering all elements from raw materials to packing are needed, proportionate to the increased probability of harming consumers [23].
Release decisions for allergen-free production
Testing for the specified allergen in products provides effective verification of allergen management controls, yet never substitutes for reliable allergen management [24]. Free-from claims remain absolute unless regulatory limits exist [24]. Facilities making free-from claims need validated control systems with allergen-specific analytical confirmation rather than ATP hygiene indicators [23].
Situations that need definitive allergen confirmation
Allergen-specific tests are recommended to understand if an allergen concern has been addressed [22]. ELISA-based methods remain less prone to matrix interference and more reliable for protein detection accuracy, ensuring package contents match label declarations [22].
Practical Implementation and Integration
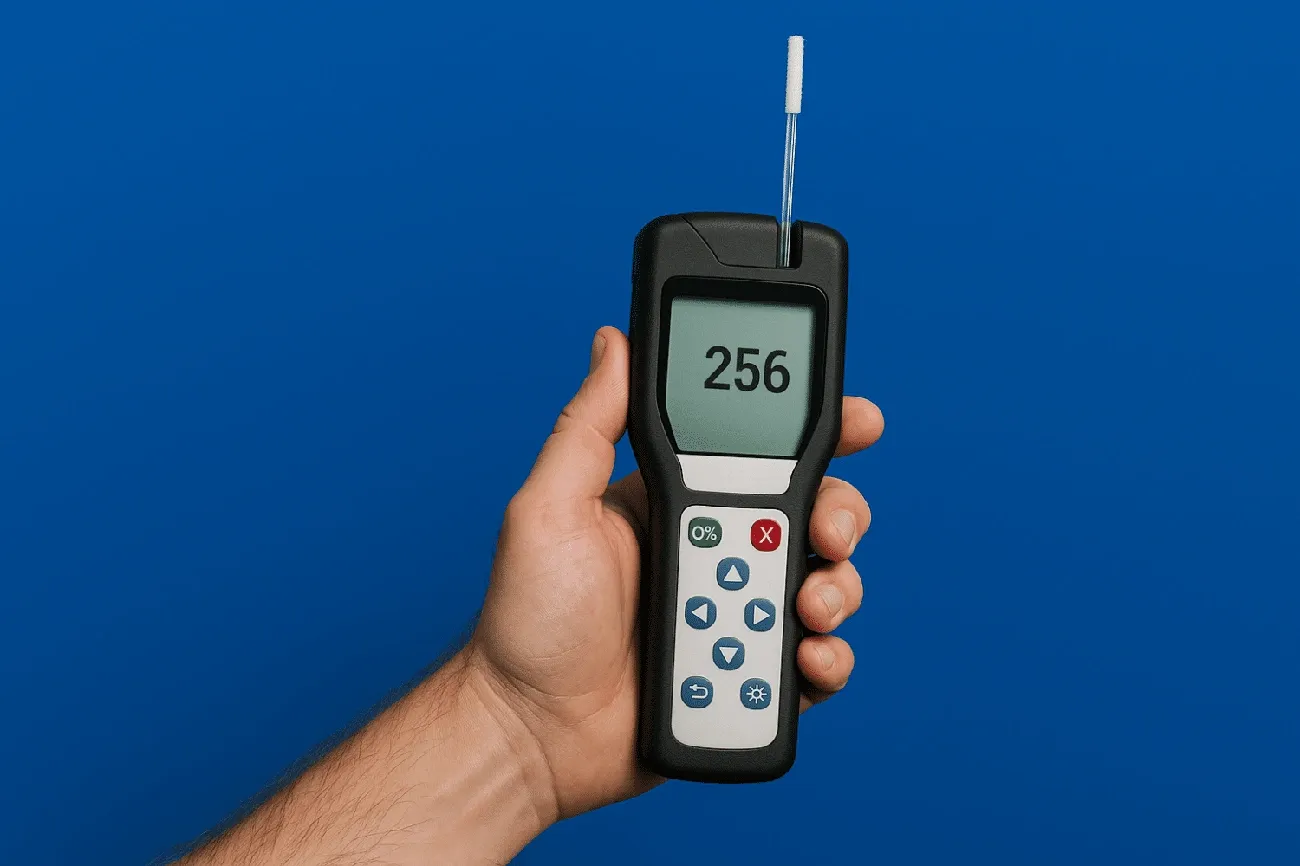
Image Source: Foremost UK
How to implement ATP testing effectively
Facilities establish baseline RLU scores by collecting six to ten data points per surface type after verified cleaning, calculating 95th-percentile pass thresholds before finalising caution and fail tiers [25]. Staff training ensures technicians understand correct swab collection and result interpretation [26]. Documentation requirements mandate tracking results over time and visualising trends to improve training and performance [26]. Corrective action protocols require recleaning and retesting when RLU scores exceed acceptable levels [26]. Facilities must retain all ATP records for a minimum of two years to meet FSMA §117.190 record retention requirements [25].
ATP works with other verification tools
The A3 test used with methods such as microorganism culture and food allergen tests provides useful strategy to identify contamination sources [27]. Lateral flow tests screen surfaces for allergenic proteins faster, whilst ELISA-based methods prove less prone to matrix interference and more reliable for protein detection accuracy [28]. Well-laid-out allergen risk assessments guide deployment of these complementary methods.
Role within layered verification systems
Methods used together or in sequence reduce failure modes of single monitoring methods by balancing weaknesses with strengths [29]. ATP provides daily pre-operational verification whilst microbiological testing supports periodic programme validation [30].
HACCP and risk assessment integration
FSMA §117.135(c)(3) requires sanitation controls managed to keep in conditions adequate to substantially reduce hazards, which ATP verification supports [25]. Facilities integrate allergen controls into HACCP plans with proper hazard analysis and designated preventive controls [8].
Common industry mistakes to avoid
Facilities apply ATP swabs designed for general surface cleanliness to allergen control verification, a purpose they cannot fulfil [9]. Damaged or improperly stored swabs create unreliable data and produce false-pass readings similar to true passes [25].
Audit expectations and evidence requirements
Auditors assess whether allergen plans integrate into food safety plans, observe sanitation changeovers during walkthroughs, verify labels against lot-specific production data, and review training records tied to high-risk roles [8]. Documented environmental monitoring is required to verify that sanitation controls implement and reduce hazards [25].
Conclusion
ATP testing serves food manufacturers as a rapid hygiene verification tool, but relying on it for allergen detection creates most important safety gaps. The technology identifies organic residue within seconds and supports daily sanitation monitoring and trend analysis. But it cannot separate allergenic proteins from general food debris or microbial contamination.
Facilities should integrate ATP within layered verification systems rather than deploying it as standalone allergen confirmation. Rapid ATP monitoring combined with allergen-specific lateral flow tests and periodic ELISA validation delivers strong protection. Quality teams that understand these differences build programmes matching technical capabilities to actual verification requirements. This protects consumers while maintaining operational efficiency.
Key Takeaways
ATP testing provides rapid hygiene verification but cannot reliably detect specific allergens, creating critical safety gaps when used inappropriately for allergen control.
• ATP testing measures general organic residue, not specific allergenic proteins, making it unsuitable as primary evidence for allergen removal verification.
• Allergenic proteins can persist on surfaces even when ATP readings indicate “clean” status due to ATP degradation from heat and cleaning chemicals.
• Use ATP for routine hygiene monitoring and trend analysis, but rely on allergen-specific ELISA or lateral flow tests for definitive allergen verification.
• High-risk allergen changeovers and free-from product claims require allergen-specific testing methods rather than general hygiene indicators like ATP.
• Implement layered verification systems combining ATP’s speed for daily monitoring with allergen-specific methods for critical control points and validation studies.
The most effective allergen control programmes use ATP as a supporting tool within comprehensive verification systems, not as a substitute for allergen-specific detection methods that regulatory compliance and consumer safety demand.
FAQs
Q1. What does ATP testing measure during cleaning verification? ATP testing measures the presence of adenosine triphosphate, a molecule found in all living and once-living cells. It detects organic residue on surfaces, including food particles, microbial contamination, and other biological material. The test provides rapid results in relative light units (RLU) that indicate overall surface cleanliness, though it cannot identify specific types of contamination or distinguish between different organic sources.
Q2. Can ATP testing reliably detect food allergens on surfaces? No, ATP testing cannot reliably detect food allergens. Whilst it identifies general organic residue, it cannot differentiate allergenic proteins from other food debris or microbial contamination. Allergenic proteins may persist on surfaces even when ATP readings indicate cleanliness, particularly after heat or chemical exposure that degrades ATP whilst leaving proteins intact. Allergen-specific tests such as ELISA or lateral flow immunoassays are required for definitive allergen verification.
Q3. How quickly does ATP testing provide results compared to other methods? ATP testing delivers results in approximately 10 to 15 seconds, enabling immediate corrective action when sanitation failures occur. This represents a significant advantage over microbiological culture methods, which require 24 to 72 hours for results. The rapid turnaround makes ATP testing particularly valuable for pre-operational verification in high-volume production environments where equipment must return to service quickly after cleaning.
Q4. When should facilities use ATP testing for allergen control programmes? ATP testing is appropriate for routine hygiene verification, trend monitoring, and identifying gross contamination that suggests inadequate cleaning. It supports allergen control programmes as a supplementary tool within layered verification systems. However, facilities should not rely on ATP alone for high-risk allergen changeovers, validation studies, or release decisions for allergen-free products, where allergen-specific testing methods are essential.
Q5. What are the main limitations of ATP testing for allergen detection? ATP testing cannot identify specific allergenic proteins, as it responds identically to ATP from all sources. Low-ATP foods such as refined oils and starches may carry allergen proteins with minimal signal, whilst non-allergenic organic matter produces elevated readings. Additionally, cleaning processes that destroy ATP through heat or chemicals may leave allergenic proteins intact, creating false-negative results that pose safety risks.
References
[1] – https://www.fda.gov/media/129671/download
[2] – https://emportllc.com/protein-swabs-in-food-service/
[3] – https://www.neogen.com/en/china/neocenter/blog/your-guide-to-atp-testing/?srsltid=AfmBOopVx4mpPVUAhW9gmuAbJYOdjv_4OJ6HceXF1Erkph_P9_RLcvRw
[4] – https://www.neogen.com/en/usac/neocenter/blog/atp-and-protein-testing-for-hygiene-monitoring/?srsltid=AfmBOoqmue8LiHtsoAbpeqkErcHdxKiOzQi-dHh2p8sjqERCKUmIlzqQ
[5] – https://www.klipspringer.com/blogs/allergen-testing-and-the-a3-system-everything-you-need-to-know/
[6] – https://www.neogen.com/en/usac/neocenter/blog/how-to-establish-effective-rlu-thresholds-for-atp-testing/?srsltid=AfmBOorRrSJqfsLwgaBnLM3-BfrAZEWSEvND12VY2w3deF0Tv1v3gQgA
[7] – https://www.food-safety.com/articles/3812-allergen-validation-analytical-methods-and-scientific-support-for-a-visually-clean-standard
[8] – https://www.registrarcorp.com/blog/food-beverage/food-safety/sqf-allergen-controls/
[9] – https://www.romerlabs.com/en/library/knowledge/detail/why-atp-isnt-a-substitute-for-allergen-verification
[10] – https://www.pda.org/pda-letter-portal/home/full-article/visual-inspection-practises-of-cleaned-equipment-part-i
[11] – https://www.pharmavalidation.in/visual-cleanliness-in-pharma-limits-lighting-inspection-conditions/
[12] – https://cleaningvalidation.com/memos/visually-clean-and-visual-limits/
[13] – https://labtekservices.co.uk/surface-testing-for-food-safety/
[14] – https://www.klipspringer.com/blogs/protein-swabs-vs-a3-testing-everything-you-need-to-know/
[15] – https://www.hygiena.com/food-safety/allergen-detection
[16] – https://www.sciencedirect.com/science/article/pii/S030881462302914X
[17] – https://www.neogen.com/en/usac/neocenter/blog/allergen-testing-methods-explained/?srsltid=AfmBOooC-uPhxyF27a6ybbI1DSIeZSnzSDoeVcnQnK3fjCB0zEgb80Nw
[18] – https://www.sychem.co.uk/blog/what-is-an-atp-test/
[19] – https://www.klipspringer.com/blogs/qa-beyond-atp-the-next-generation-of-reliable-hygiene-verification/
[20] – https://www.rochestermidland.com/blog/checklist-9-considerations-for-allergen-control-in-the-food-industry/
[21] – https://sgsystemsglobal.com/glossary/allergen-changeover-verification/
[22] – https://www.neogen.com/en/usac/neocenter/blog/why-atp-testing-is-not-sufficient-for-allergen-control-programmes/?srsltid=AfmBOoqDWbpJ2-nSOo2Q8mRzQyGXf-TJLrnasjpVxR-9RXeU7728Vqpv
[23] – https://www.fdf.org.uk/globalassets/resources/publications/brc-free-from-guidance.pdf
[24] – https://www.rssl.com/media/0fzdmk2p/rssl-white-paper-successful-free-from-production.pdf
[25] – https://www.alleratech.com/blog/atp-testing
[26] – https://www.issa.com/articles/atp-test/
[27] – https://www.sciencedirect.com/science/article/pii/S0362028X22067102
[28] – https://www.neogen.com/en/usac/neocenter/blog/why-atp-testing-is-not-sufficient-for-allergen-control-programmes/?srsltid=AfmBOoqk8EM3u3DowKUg_PKkts1d5uGRrXtaKN1ff6Vc9q6TBTaPyvgF
[29] – https://www.gemscientific.co.uk/downloads/1619005576ATP_Cleaning_Verification_Study_Summaries_062016.pdf
[30] – https://pmc.ncbi.nlm.nih.gov/articles/PMC8090886/