
Key Takeaways
Understanding protein detection limits is crucial for effective allergen control, as these thresholds determine whether cleaning procedures adequately protect allergic consumers from cross-contamination risks.
• ELISA methods offer superior sensitivity (0.1-1.0 µg/g) compared to rapid tests, making them ideal for validation studies and regulatory compliance verification.
• Total protein swabs cannot distinguish between allergenic and non-allergenic proteins, serving only as general cleanliness indicators rather than allergen-specific verification tools.
• Detection of allergen residues on surfaces doesn’t directly correlate to consumer exposure—cross-contamination transfer rates mean food contamination levels are typically 100 times lower than surface readings.
• Successful allergen verification programmes require layered approaches combining rapid lateral flow devices for daily monitoring with ELISA confirmation for critical decisions.
• Matrix complexity, thermal processing, and surface materials significantly affect detection accuracy—facilities must validate test methods for their specific conditions to prevent false results.
The key to effective allergen management lies in understanding that detection limits represent analytical capabilities, not safety thresholds. When properly implemented alongside VITAL reference doses and risk-based assessments, protein detection becomes a powerful tool for protecting consumers whilst maintaining operational efficiency.  ## Introduction
Protein detection limits define the minimum concentration of residue that verification methods can identify during allergen cleaning validation. Research shows that detection sensitivity varies between methods: the A3 test shows lower detection limits than ATP testing, while ELISA remains the most used detection method in published studies. Threshold doses represent the lowest amount of a food allergen capable of triggering an allergic reaction. Selecting protein detection methods with adequate sensitivity is vital to control cross-contamination. This piece gets into protein detection assays and their sensitivity ranges. It also covers practical applications in cleaning verification and how detection limits relate to allergen threshold levels in food safety programmes.
What Are Protein Detection Limits
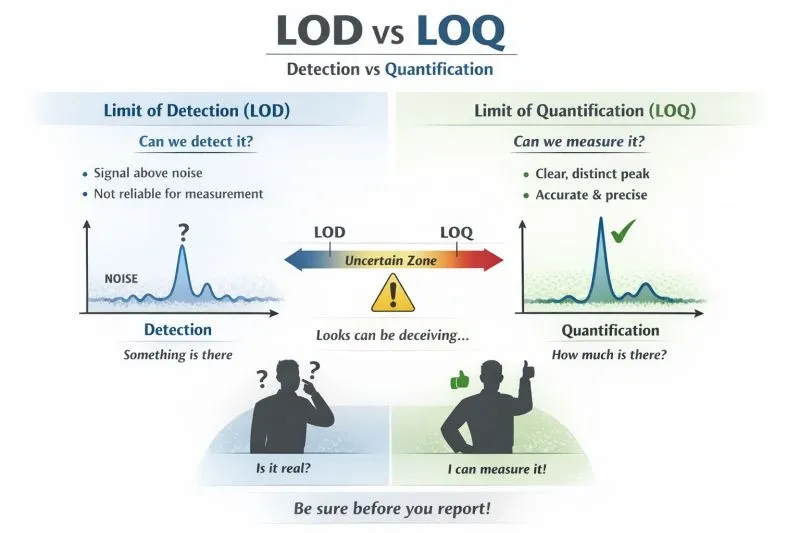
Image Source: LinkedIn
What Are Protein Detection Limits
Definition of Detection Limits (LOD and LOQ)
Specific numeric estimators characterise the performance of protein detection methods through analytical figures of merit that define prediction ability and detection capability [1]. Two critical parameters govern sensitivity in allergen verification: the Limit of Detection (LOD) and the Limit of Quantification (LOQ). The LOD represents the lowest concentration of a substance that can be reliably distinguished from the absence of that substance, with a defined level of statistical confidence [2]. This parameter answers a binary question: whether protein residue is present above background noise. The measured signal achieves statistical significance compared to blank samples at the LOD, confirming the presence of the target [3].
The LOQ, in contrast, denotes the lowest concentration at which a sample can be reliably detected while meeting predefined criteria for bias and imprecision [3]. This parameter is always a higher concentration than the LOD because it represents the level at which accurate measurement becomes possible [2]. While LOD confirms presence, LOQ defines the lower boundary of the assay’s quantitative range where numerical values can be assigned with confidence [3].
These parameters follow established statistical approaches for calculation methods. The LOD is determined by multiplying the standard deviation of a series of blank readings (around 20) by three [3]. This approach assumes that the majority of readings fall within three standard deviations. The LOQ involves multiplying the standard deviation of the blank readings by ten, providing a substantial safety margin that will give a reduced likelihood of false results [3]. The LOQ is often empirically defined as the lowest concentration on the standard curve that yields an inter-assay precision (coefficient of variation) of less than 20% for ELISA methods, a standard in bioanalytical method validation [3].
Evaluating protein detection assays requires understanding units of measurement. The term ppm (parts per million) is equivalent to mg/kg (milligrammes per kilogramme of food), while ppb refers to parts per billion (microgrammes per kilogramme of food) [4]. Changes in parameters such as LOD and LOQ are not always apparent when comparing kits in the literature, especially since kit manufacturers tend to retain the name of each kit even when improvements or other alterations are made [4].
Difference Between Qualitative and Quantitative Thresholds
The difference between qualitative and quantitative detection thresholds has profound implications for allergen cleaning validation programmes. Qualitative methods apply detection limits that indicate a concentration at which a result of detection is expected to occur with a given frequency, 90–100% probability of detection [5]. These methods provide a yes/no answer regarding allergen presence without attempting to measure precise quantities.
Quantitative methods implement a fixed calibration curve and set their stated method LOQ as the lowest non-zero calibrant [5]. A sample with a true concentration exactly equivalent to the LOQ calibrant concentration will deliver a result greater than the LOQ 50% of the time and a result less than the LOQ 50% of the time under optimal method performance (to name just one example, 100% recovery and uniform precision) [5]. A sample with a concentration equal to the LOQ will deliver a result of below the LOQ 50% of the time. This situation is different from qualitative methods where detection probability approaches certainty at the stated limit.
Method instructions recommend that results less than the LOQ only be reported as below the LOQ [5]. The LOQ functions as a censoring point for the method in these instances. So only samples containing analyte concentrations greater than the LOQ would be expected to deliver results greater than the LOQ [5]. Data points that fall between the LOD and LOQ are often reported as “< LOQ” or as estimated values, as their precise concentration cannot be assigned with confidence [3].
How Detection Limits Apply to Cleaning Verification
Detection limits serve as validation tools for cleaning procedures in facilities handling multiple product lines [2]. A facility producing both gluten-free and wheat-containing products must verify that gluten residues fall below an acceptable detection limit after cleaning. The selection of appropriate rapid detection methods requires understanding that the technique must be sensitive for the target substance in the specific matrix [6].
Recovery represents another critical method performance parameter for quantitative food allergen methods [5]. Many studies indicate that different factors, including matrix composition and food processing, can affect the quantitative recovery of food allergens. Many think about 80–120% recovery to be optimal for method validation, but 50–150% recovery is acceptable for allergen methods given the many complex scenarios involved [5].
Understanding what constitutes fit-for-purpose detection becomes paramount when establishing verification protocols. Each technique is different and may not produce comparable results [6]. An inappropriate allergen technique can produce a false negative result (the allergen is present, but the test is not capable of detecting the allergen) or a false positive result (the allergen is not present, but the test identifies it as being present) [6]. The required outcome for the test must arrange with the detection capabilities and limitations of the chosen method within the broader context of evidence-based verification protocols.
Types of Protein Detection Methods for Allergen Cleaning

Image Source: ProGnosis Biotech
Food manufacturers implementing allergen cleaning validation programmes rely on several distinct protein detection assays. Each offers different sensitivity profiles, turnaround times and applications. Selection between methods depends on whether you need immediate line-side decisions or detailed laboratory analysis to support regulatory compliance and finished product release.
Protein Swabs (Colorimetric Methods)
Colorimetric protein swabs employ the biuret method. This chemical reaction uses copper salts in alkaline solution to form a purple complex with substances containing two or more peptide bonds [1]. The colour change’s intensity relates to the amount of protein present on the sampled surface. These tests provide semi-quantitative assessment, with results visible within 10 minutes [3]. Detection limits for commercial protein swabs reach approximately 10 µg protein [3]. This makes them suitable to verify cleaning effectiveness quickly.
The biuret reaction measures total protein. It does not distinguish between allergenic and non-allergenic sources [1]. Any protein residue triggers the colour change, whether it comes from peanuts, meat, dairy or other proteinaceous materials. This non-specificity represents both an advantage and limitation. Protein swabs offer useful verification that cleaning has removed organic residues when no allergen-specific rapid test exists [1]. Studies comparing protein swabs with more sensitive methods revealed major constraints. Research found that protein swabs could only detect samples up to a 10²-fold dilution [7]. This is nowhere near as sensitive as advanced ATP systems or ELISA methods. Thermal processing and chemical exposure during food production can denature proteins. This compromises the accuracy of protein-specific tests whilst leaving A3 system performance unaffected [7].
Lateral Flow Devices (LFDs)
Lateral flow devices represent qualitative or semi-quantitative immunochromatographic tests based on ELISA principles [5]. These allergen-specific tests use antibodies designed to detect particular allergenic proteins. They provide rapid screening capabilities without laboratory infrastructure [8]. The testing procedure involves four main zones within the strip: the sample pad, conjugate pad, test zone and wicking pad [5]. Sample extract containing target protein flows through these zones via capillary action. Visible lines appear when allergenic proteins bind to immobilised antibodies [9].
Lateral flow tests deliver results within approximately 10 to 15 minutes [5][1]. This makes them ideal for product changeovers and sanitation verification between allergen and non-allergen production runs [5]. Detection sensitivity varies by manufacturer and target allergen. The RIDA®QUICK Soya can detect heated soy proteins from meat or cereal products with a detection limit of 0.5 μg / 100 cm² [10]. Validation requirements are critical. Advertised detection limits can vary depending on the contamination source [8]. A milk lateral flow device calibrated using liquid milk may exhibit different detection limits when the contaminant comes from cheese or whey [8].
Laboratory-Based Methods (ELISA)
Enzyme-Linked Immunosorbent Assay methods provide the highest sensitivity and specificity for protein detection in allergen control [8]. Nearly all commercial ELISA allergen testing kits employ the sandwich format. One antibody captures the target protein whilst a second antibody binds to a different site and carries the detection enzyme [8]. This dual antibody recognition system boosts specificity and resistance to false positives, especially when you have complex or processed matrices [8].
ELISA methods target allergenic proteins or their constituent peptides [2]. These methodologies are represented by ELISA and peptide LC-MS/MS at present. ELISA remains the preferred analysis method because it can detect allergens down to prescribed action levels [2]. Quantitative results expressed in parts per million support evidence-based decisions and regulatory compliance [8]. Comparison studies between ELISA kits show variability in LOQ values. Published LOQ ranges for gluten detection include 0.3 ppm for the Morinaga wheat protein kit, 3 ppm for BioKits, 4 ppm for AgraQuant and 5 ppm for RIDASCREEN Gliadin and ALLER-TEK kits [7].
ATP Swab Testing
ATP testing measures adenosine triphosphate, the principal energy-transfer molecule present in all living cells [1]. Conventional ATP swabs cannot distinguish between bacteria, yeast, mould or food residue [1]. This makes them unsuitable as standalone tools for allergen-specific verification. The A3 system represents an advancement. It detects all three forms of the adenosine molecule: ATP, ADP and AMP [7]. Comparative analysis across 40 allergenic products regulated in the USA, Canada, EU or Asia revealed that the A3 system offered heightened sensitivity for 35 products. Conventional ATP tests proved superior in zero instances [7]. Studies showed correlation between A3 results and ELISA quantification of milk protein throughout the cleaning process [7]. All the same, the A3 system cannot replace allergen testing. You should never rely upon it for allergen identification [7]. It functions instead as a complementary verification tool within broader evidence-based protocols for food safety audits.
Sensitivity and Detection Ranges of Different Methods
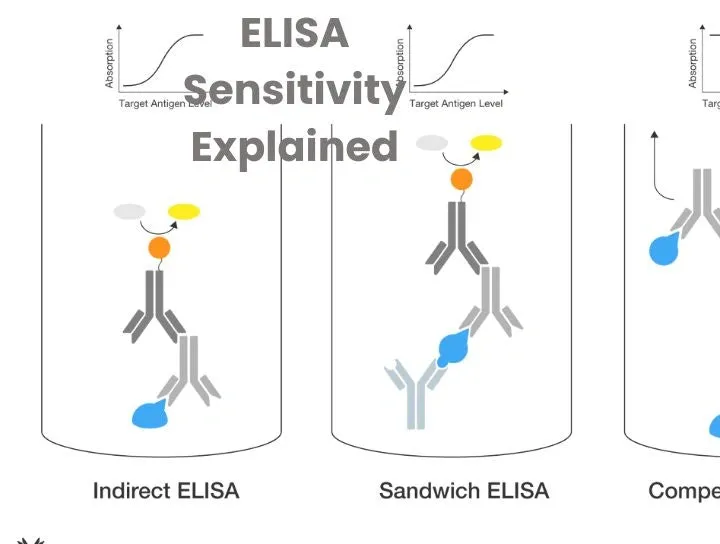
Image Source: Beta LifeScience
Sensitivity and Detection Ranges of Different Methods
Typical Detection Ranges of Each Method
ELISA methods show superior sensitivity compared to rapid testing alternatives. Detection capabilities reach picogramme levels in optimal conditions. Research dissecting walnut protein detection found that ELISA could detect 0.5 µg/g walnut protein in blended and incurred food matrices [11]. The same study showed ELISA detected 0.25 µg/g of walnut protein in complex food matrices spiked with walnut extract and suggested high recovery rates between 71–97% [11]. Lateral flow immunoassays tested against similar matrices achieved detection limits of 1 µg/g in blended foods and 0.5 µg/g in spiked samples [11].
Laboratory-based ELISA systems exhibit dynamic ranges that span several orders of magnitude. Standard sandwich ELISA configurations achieve detection from 7.8–500 pg/mL [4]. Advanced immunoassay platforms extend this range, and ProQuantum systems show sensitivity from 0.064 pg/mL to over 1,000 pg/mL [4]. This expanded dynamic range eliminates the need for serial dilutions that conventional ELISA often requires due to small standard curve ranges [4].
Lateral flow devices designed for environmental monitoring show practical sensitivity suitable for surface verification. Studies document LFIA detection of 0.1 µg walnut protein on working surfaces [11]. The dynamic range for lateral flow assays spans from mid picomolar to high micromolar concentrations [6], though membrane properties influence performance parameters by a lot. Faster flow rates reduce background signals but compromise sensitivity and generate false negatives. Slower wicking rates increase analyte residence time and improve detection capability at the expense of higher backgrounds [6].
Variability Between Test Kits and Manufacturers
Performance variation between commercial kits represents a challenge for standardisation efforts. Comparative analysis of seven commercial egg ELISA kits across nine food matrices revealed differences in recovery performance [7]. All seven kits achieved qualitative detection of egg at the VITAL3 ED01 level of 0.2 mg total egg protein [7]. Quantitative recovery within acceptable criteria varied by matrix. Cookie, chocolate, stock cube, and wine matrices supported acceptable recovery across all kits tested [7]. Four or more kits met recovery criteria for pasta, vegetable drink and milk, ice cream, and salad dressing [7]. Meat and meat replacer matrices proved most challenging. High matrix effects limited acceptable recovery to a single kit [7].
Proficiency testing data analysis shows that ELISA kit repeatability and reproducibility limits have been reached [7]. The mean ratio san/σp barely managed to keep acceptable levels and suggested no improvement in repeatability occurred during the data analysis period [7]. Reproducibility limits for ELISA kits had been reached [7] and suggest fundamental constraints in current antibody-based detection technology.
Trade-Off Between Speed, Sensitivity, and Specificity
Mass spectrometry techniques offer improved specificity through careful selection of species-specific peptide sequences. They provide protein identity information and permit wider linear dynamic ranges [7]. LC-MS/MS methods show reduced susceptibility to food processing effects compared to antibody-based approaches [7]. Despite these advantages, mass spectrometry exhibits lower sensitivity levels than ELISA methods and can show poor recovery depending on extraction protocols used [7].
Thermal processing affects protein detectability across all immunoassay platforms. Heat treatment alters protein folding and initiates oxidation processes that lead to amino acid modification. It creates protein-bound carbonyls and promotes aggregation [7]. Each transformation affects antibody recognition sites and reduces protein extractability, which directly affects recovery in testing procedures [7].
Protein as a Proxy for Allergen Risk

Image Source: ALS Global
Using Protein Detection to Indicate Allergen Presence
Each food allergen relates to a protein molecule, with the exception of sulphur dioxide and sulphites [6]. This biochemical reality underpins the rationale for using protein detection as an indicator of allergen presence during cleaning verification. Proteins represent the immunologically active components that trigger allergic reactions [5]. So measuring protein residues provides a valid approach to assessing whether allergenic material persists on equipment surfaces following sanitation procedures.
The VITAL programme, managed by the Allergen Bureau, has driven a most important change from matrix-based coverage towards protein-based quantification [5]. Allergic reactions are initiated by specific proteins rather than the total mass of the allergenic food, and this transition acknowledges that fact [5]. Absolute quantification of proteins in foods contributes to assessing the risk of allergen levels that allergic consumers will be exposed to [12]. Detection of protein residues serves as a proxy indicator that cleaning has removed allergenic material from production surfaces when we verify cleaning.
Limitations of Total Protein Detection
Non-specific allergen tests, also known as protein screening assays, detect total protein residues without identifying which specific allergen the protein originated from [10]. Total protein swabs cannot discriminate between allergenic and non-allergenic proteins [13]. A positive protein swab result does not identify what protein is present or even confirm that an allergen is present [10]. To name just one example, commercial colorimetric swabs such as ALLTEC60 can detect as little as 3µg of protein and change colour when protein residues from egg, milk, gluten, soy, peanut, and almond are present [10]. But these devices provide no information about which of these allergens triggered the positive result.
Cross-reactivity represents another most important limitation. Lupin ELISA kits cross-react with chickpea (0.0003%), lentil (0.0004%), soy flour unroasted (0.0700%), soy flour roasted (0.0009%), and soy lecithin (0.002%) [2]. Mustard ELISA kits cross-react with rapeseed and other seeds from the Brassica genus [8]. Test kit manuals do not always include this cross-reactivity information, highlighting the necessity for manufacturers to perform complete testing and make cross-reactivity data available to the public [2].
Allergen-Specific vs Non-Specific Detection Methods
ELISA kits detect allergenic proteins based on antibody recognition [6] and provide allergen-specific identification that total protein methods cannot achieve. PCR techniques target DNA sequences unique to allergenic foods [8]. In spite of that, PCR tests tend to be qualitative, and the results obtained cannot be converted into protein values [8]. The presence or absence of DNA does not prove presence or absence of protein [8]. ELISA remains the preferred method where antibodies can detect target proteins in the specific matrix to support quantitative risk assessment arranged with VITAL reference doses.
When Total Protein Detection Is Appropriate
The rationale for total protein screening follows simple logic: if a surface is protein-free, it is reasonable to infer that it will also be allergen-free [13]. Total protein swabs prove valuable and budget-friendly when controlling multiple allergens at once [13]. Facilities managing several allergen categories benefit from rapid, inexpensive screening that confirms general cleanliness before proceeding to allergen-specific verification when needed. This layered approach balances speed, cost, and specificity within complete allergen cleaning validation programmes.
Threshold Levels and Regulatory Context
Image Source: ResearchGate
Regulatory Expectations and Precautionary Labelling
Food businesses in the UK decide when precautionary allergen labelling (PAL) is necessary, as no thresholds or standards are set out in UK law about when PAL should be applied or the wording to be used [14]. Consumers do not trust these labels universally because of this lack of consistency [14]. Precautionary allergen labelling should only be used when there’s a risk of allergen cross-contact within the supply chain that cannot be removed through risk management actions [15]. The Food Standards Agency states that excessive use of precautionary allergen labels can limit consumer choice without need and devalue the warning for consumers with food allergies. This leads to risk-taking behaviours [15].
The U.S. Food and Drug Administration convened a virtual public meeting on food allergen thresholds in February 2026. This is a big deal as it means that allergen risks may be assessed and managed differently [3]. The FDA emphasised that it has not yet established or endorsed specific threshold levels and is still gathering stakeholder input [3].
VITAL Concepts and Reference Doses
Reference doses represent the milligramme protein level below which only the most sensitive individuals in the allergic population (between 1 and 5%, based on data quality) are likely to have an adverse reaction [1]. The ED05 is the dose of allergenic protein at which 5% of the allergic population will have a reaction with objective symptoms [14]. The ED05 is 2.1mg peanut protein for peanuts [16]. The VITAL programme uses these reference doses as the science underpinning decisions about precautionary allergen labelling for cross-contact allergens [9]. Action Level concentrations are calculated using the Reference Dose and a Reference Amount specific to the food [9]. Businesses can determine whether contamination levels warrant PAL application by implementing structured allergen risk assessment protocols.
Internal Action Limits vs Detection Limits
Official food control laboratories in Germany have established internal action values to support uniform evaluation of analytical results [1]. Food control authorities use these action values as internal thresholds when evaluating analytical results, especially for positive allergen findings without declaration [17]. These internal action values cannot be equated with legal threshold values [1]. Lower detection limits for available allergen ELISA or immunoassay test kits are in the range of 0.1 to 1.0 µg protein/g of food currently [18].
Risk-Based Threshold Setting in Practise
The FAO/WHO expert committee published ED05-based reference doses between 2022 and 2024 in five meeting reports [16]. Labelling should indicate this allergen in a PAL statement when the level of potential unintended allergen presence exceeds the reference dose in a realistic serving [16]. Levels of allergen below the ED05 level will provoke allergic reactions in less than 5% of the allergic population, with reactions that will be mild in nature [16]. Understanding how protein detection limits relate to these evidence-based thresholds is required to develop resilient food allergen control programmes.
Factors That Affect Detection Limits
Surface Type and Texture
Recovery efficiency varies quite a bit between surface materials used in food production environments. Research comparing swab performance on Formica versus stainless steel surfaces revealed major differences in allergen capture rates [19]. Five different swab materials tested for egg and milk allergen recovery showed that material selection really affects detection accuracy when low allergen amounts (0.08 µg egg, 0.123 µg milk powder) contaminate surfaces [19]. Stainless steel surfaces present unique challenges. Studies show that two-thirds of fibrinogen protein remained adhered even after 15 strokes of scrubbing with water [20].
Cleaning Effectiveness and Residue Removal
Keeping instruments moist improves cleaning efficiency compared to dried residues [20]. Enzymatic detergents performed about 10 times better at protein removal than alkaline detergents [20]. Areas such as screws and hooks on instruments retained protein even when cleaned with enzymatic detergent [20]. Recovery rates from test samples treated with 1% SDS reached 70.6% at 60°C but dropped to 35.0% at 95°C [21].
Residue Type (Fat, Baked-On, or Protein-Rich)
Chocolate matrices present big analytical challenges. Tannins and polyphenols bind allergenic proteins and form insoluble complexes that are difficult to extract [11]. Fat content and polyphenols interfere with lateral flow device testing, making ELISA preferred for such matrices [22]. Thermal processing alters protein folding and initiates oxidation. It creates protein-bound carbonyls and promotes aggregation, which compromises antibody recognition sites [6].
Sampling Technique and Recovery Efficiency
Swab storage conditions affect allergen recovery quite a bit. Research comparing storage at room temperature, 37°C, 4°C, and -20°C showed that colder temperatures kept recoveries higher and more stable [23]. The biggest decrease in recovery occurred between days 0 and 1 [23]. Spike recovery data must fall within 80-130% of spiked levels for new matrices [22].
Time Between Contamination and Testing
Delays in shipping and temperature variations affect allergen residue recovery from environmental swabs [24]. Swabs stored at -20°C and 4°C showed better results. Both Veratox and Morinaga ELISA kits achieved higher recoveries compared to swabs stored at room temperature throughout a 14-day period [23]. Current best practise recommends shipment on ice with same-day delivery [24].
Interpreting Detection Results in Practise
Image Source: https://pixabay.com/
Understanding Detection vs Actual Risk
Validation studies typically employ quantitative ELISA to establish measures for effective cleaning. Testing occurs at least three times across contamination sources, pre-clean surfaces, post-clean surfaces and finished products [7]. Correlation between qualitative lateral flow devices and ELISA during validation proves vital for ongoing verification programmes [7]. Detection of allergen on food contact surfaces does not equate directly to consumer exposure. Cross-contamination involves a transfer coefficient where not all surface allergens migrate to food [4]. Surface testing recovers swabs into small diluent volumes. Product testing macerates samples in large volumes. This results in allergen levels in food products approximately 100 times lower than surface detection suggests [4].
False Positives and False Negatives
Matrix interferences can produce false positive results. Tests detect allergens absent from samples and potentially trigger unnecessary recalls [8]. False negatives occur when tests fail to detect present allergens and pose consumer safety risks [8]. Spike recovery checks alleviate these risks. Known allergen quantities are added to samples and results are compared [8]. Cross-reactivity causes false positives when tests detect proteins that are similar [8]. Mustard ELISA kits cross-react with rapeseed and other Brassica seeds, to name just one example [8].
Importance of Trend Analysis
Average validation results plus comfort factors establish target levels for ongoing verification [4]. ATP measurements require presence on surfaces when detectable allergen residues are absent [4]. Trend monitoring identifies patterns that suggest cleaning programme degradation before failures occur.
When to Escalate to Allergen-Specific Testing
Surfaces sometimes pass lateral flow devices but fail ELISA. Risk assessments determine whether detectable allergen presents consumer risk [4]. ATP and protein swabs serve as verification tools [25]. Samples that pass A3 testing make allergen-specific tests more likely to pass and reduce wasted lateral flow devices [7].
Understanding What a ‘Pass’ or ‘Fail’ Really Means
Clause 4.11.3 of BRCGS Version 9 requires defining acceptable and unacceptable cleaning performance limits. Specified corrective actions must be taken when results fall outside acceptable ranges [7]. Failed validation rounds require root cause analysis before repeating studies [26]. Successful allergen cleaning validation demonstrates consistent achievement of cleaning goals through worst-case scenario testing [27].
Building an Effective Allergen Verification Programme
Image Source: LinkedIn
How Detection Limits Line Up with HACCP Principles
HACCP Principle 3 requires establishing confirmed critical limits at control points [28]. Allergen management functions as a control measure that needs confirmation, although it rarely constitutes a critical control point [29]. Codex Alimentarius specifies that critical limits must be observable and measurable, subject to up-to-the-minute monitoring [28]. Protein detection limits establish the observable threshold that confirms cleaning effectiveness.
Cleaning Validation Studies Need Support
Validation demonstrates that cleaning procedures reduce hazards to acceptable levels under worst-case scenarios [4]. Studies must repeat at least three times [4][7] and test contamination sources, pre-clean surfaces, post-clean surfaces, and finished products [7]. ELISA provides validation data. Lateral flow devices run in parallel to establish correlation [4][7].
A Layered Verification Approach Works Best
Manufacturers employ both lateral flow and ELISA as layered verification strategies [30]. Lateral flow supports daily monitoring. ELISA confirms control measure effectiveness [30]. Well-laid-out risk assessment protocols determine appropriate verification frequency when you implement them.
How to Select Appropriate Detection Methods for Your Facility
Method selection depends on allergen type, matrix complexity, and processing conditions [8][31]. Facilities must confirm tests for specific matrices through spike recovery, with 80-130% acceptable [22][8]. Laboratories should hold ISO 17025 accreditation [22].
Common Industry Mistakes You Should Avoid
Certified methods confirmed only for specific ingredients cause false negatives when you use them [32]. Complex matrices require matrix-specific confirmation to prevent interference [32]. Insufficient communication between departments undermines allergen control programmes [32].
Best Practise Recommendations for Staff Training
Training should be role-specific and continuous. It covers receiving, storage, production, sanitation, and labelling functions [33]. Documentation proves competency during audits [33]. Regular updates address ingredient changes, new suppliers, equipment modifications, and regulatory developments [34][33].
Conclusion
Food manufacturers implementing resilient allergen control strategies must understand protein detection limits as a fundamental requirement. Detection sensitivity varies considerably between methods. ELISA offers superior quantification capabilities while lateral flow devices provide rapid line-side verification. Successful programmes employ layered verification strategies that arrange detection capabilities with threshold-based risk assessments rather than relying solely on one approach. Facilities must verify assays for specific matrices and processing conditions before selecting test methods and ensure staff understand the difference between detection limits and actual consumer risk. Evidence-based verification protocols change analytical data into meaningful allergen control that protects consumers and supports regulatory compliance if implemented correctly.
FAQs
Q1. What does a very low reading on an allergy test indicate? A very low reading, such as 0.10 ku/l (kilo units per litre), typically indicates minimal levels of specific IgE antibodies in the blood, suggesting a very low allergic response. However, this result should always be interpreted alongside clinical symptoms and medical history, as test results alone don’t provide the complete picture of allergic sensitivity.
Q2. What protein detection sensitivity is required for common food allergens? Detection sensitivity requirements vary by allergen to protect 95% of allergic individuals. For a 100g food portion, tests should achieve sensitivity of 10 ppm for egg protein, 24 ppm for peanut protein, and 30 ppm for milk protein. These thresholds represent the minimal reactive quantities that ensure adequate safety for most allergic consumers.
Q3. What detection limit do protein swab devices achieve? Protein swab devices such as AllerSnap can detect both allergenic and non-allergenic proteins across a wide concentration range. The typical detection limit for these devices is approximately 3 μg of protein, making them suitable for rapid verification of cleaning effectiveness on food contact surfaces.
Q4. How do detection limits differ between rapid tests and laboratory methods? Rapid lateral flow devices typically detect allergens at levels around 0.5-1 μg/g in food matrices, whilst laboratory-based ELISA methods achieve superior sensitivity, detecting as low as 0.25-0.5 μg/g. ELISA also provides quantitative results expressed in parts per million, supporting more detailed risk assessment and regulatory compliance.
Q5. Why might protein detection methods produce false results? False positives can occur due to cross-reactivity with similar proteins or matrix interferences, whilst false negatives may result from thermal processing that denatures proteins, poor extraction from complex matrices, or inadequate recovery during sampling. Validation through spike recovery testing (achieving 80-130% recovery) helps identify and mitigate these issues for specific food matrices.
References
[1] – https://scispace.com/pdf/action-levels-for-food-allergens-an-approach-for-official-4iqvvhm3y6.pdf
[2] – https://www.food.gov.uk/research/review-of-allergen-analytical-testing-methodologies-overall-conclusions-and-future-direction
[3] – https://allergenbureau.net/fda-signals-move-toward-risk‑based-allergen-thresholds/
[4] – https://www.romerlabs.com/en/library/knowledge/detail/10-steps-to-validating-and-verifying-allergen-cleaning-procedures
[5] – https://www.romerlabs.com/en/library/knowledge/detail/from-matrix-to-protein-the-evolving-approach-to-allergen-quantification-in-food
[6] – https://www.food.gov.uk/research/review-of-allergen-analytical-testing-methodologies-allergen-detection-methods-unbiased-literature-search
[7] – https://www.klipspringer.com/blogs/allergen-cleaning-validation-a-practical-guide-for-food-factories/
[8] – https://www.rssl.com/insights/food-consumer-goods/food-allergen-detection-choosing-the-right-testing-method/
[9] – https://vital.allergenbureau.net/vital-science/
[10] – https://www.neogen.com/en/usac/neocenter/blog/allergen-risk-assessment-when-to-use-test-kits/?srsltid=AfmBOoom68fdN6jivAb_38eHSnE94MV1Kp9ZhO60pascXIv0TzIc7swR
[11] – https://www.romerlabs.com/en/library/knowledge/detail/challenges-in-allergen-testing-spiking-and-recoveries
[12] – https://pmc.ncbi.nlm.nih.gov/articles/PMC5988494/
[13] – https://www.hygiena.com/news/total-protein-indicators
[14] – https://www.food.gov.uk/board-papers/precautionary-allergen-labelling-and-allergen-thresholds
[15] – https://www.food.gov.uk/business-guidance/precautionary-allergen-labelling
[16] – https://foodallergycanada.ca/taking-a-risk-based-approach-to-pal-the-role-of-allergen-thresholds-by-dr-sebastien-la-vieille-health-canada/
[17] – https://www.researchgate.net/publication/321535684_Action_Levels_for_Food_Allergens_An_Approach_for_Official_Food_Control_in_Germany
[18] – https://www.fda.gov/files/food/published/Approaches-to-EstablishThresholds-for-Major-Food-Allergens-and-for-Gluten-in-Food.pdf
[19] – https://www.sciencedirect.com/science/article/abs/pii/S0956713516306557
[20] – https://www.clinicalservicesjournal.com/story/10992/the-problem-of-protein-how-clean-is-clean
[21] – https://www.nature.com/articles/s41598-024-72473-1
[22] – https://www.food.gov.uk/research/review-of-allergen-analytical-testing-methodologies-stakeholder-engagement
[23] – https://www.food-safety.com/articles/11148-study-shows-how-swab-storage-time-temperature-affect-allergen-detection
[24] – https://allergenbureau.net/time-and-temperature-matter-for-allergen-testing-swabs/
[25] – https://www.neogen.com/en/usac/neocenter/blog/atp-protein-and-allergen-testing-in-production-facilities-which-should-you-use/?srsltid=AfmBOooYBgDUBwPwLfysevCyOadrHGQHxwXYCyA8fKsuUHyInhz_l7A1
[26] – https://www.rssl.com/insights/food-consumer-goods/designing-a-successful-allergen-cleaning-validation-strategy/
[27] – https://www.hygiena.com/news/allergen-cleaning-validation-and-verification
[28] – https://myhaccp.food.gov.uk/help/guidance/principle-3-establish-critical-limits
[29] – https://www.food.gov.uk/research/review-of-the-literature-and-guidance-on-food-allergen-cleaning-report-summary-and-discussion
[30] – https://www.neogen.com/en/usac/neocenter/blog/allergen-testing-methods-explained/?srsltid=AfmBOoqYpe4iv-WiyylkALWb4KdufkI2C8quiuJRpdF49v8Gas8ZU9ox
[31] – https://www.food-safety.com/articles/11362-best-practise-considerations-to-enhance-the-effectiveness-of-allergen-cleaning-and-validation
[32] – https://www.qualityassurancemag.com/article/common-errors-in-allergen-management/
[33] – https://www.fooddocs.com/post/haccp-allergen-control-programme
[34] – https://www.fdf.org.uk/globalassets/resources/publications/guidance/allergen-recall-prevention-guidance.pdf